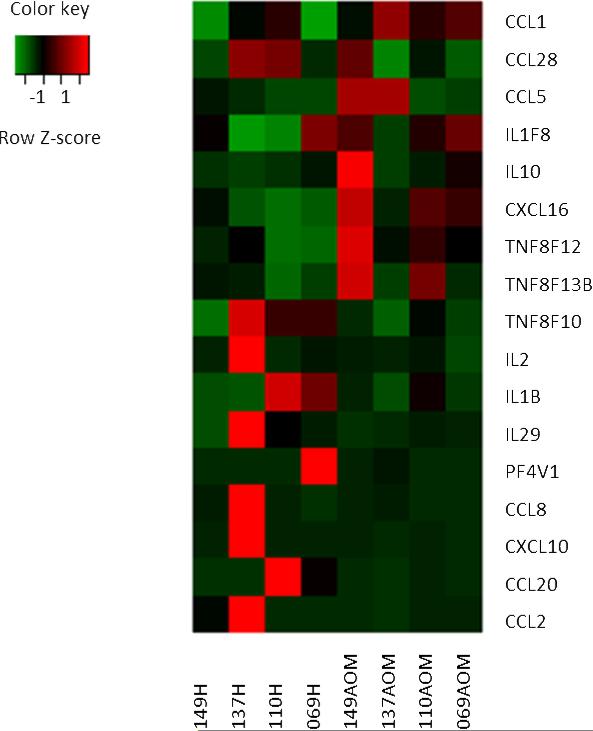
Fig. 3. Variability of gene expression among 4 children with AOM due to Spn.
Statistical package software R was used for the identification of differentially expressed genes. The profile includes 17 genes selected from the 127 immune defense response gene transcripts of PBMCs, which were >2 fold change at the comparison of the onset of AOM due to Spn and their pre-infection healthy stage. Shown are normalized expression (AOM stage) greater than (red), near (black), or less than (green) the mean of controls (healthy stage). Each column represents one child of healthy or AOM stage. Genes or transcripts are represented in rows.

