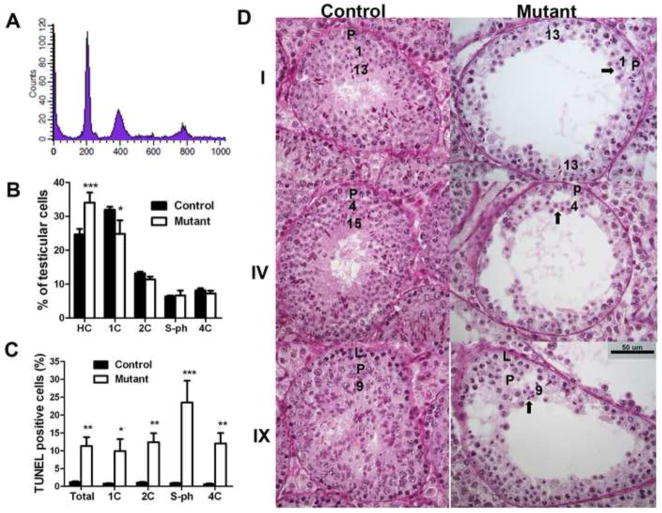
Fig. 2. Germ cell types affected in aged mutant mice.
A. Representative diagram from flow cytometry analysis of PI stained testicular cells (13-month-old control mouse). B. Percentage of testicular cell populations between 13-month-old controls (n=5) and mutants (n=4). C. Percentage of apoptotic (TUNEL positive) cells in different testicular cell populations between 13-month-old controls (n=5) and mutants (n=4). PI (for DNA ploidy) and FITC (for TUNEL assay) double-channel flow cytometry was performed. D. PAS staining of testis sections from 11-month-old mice. Cross-sections of the same stages of germ cell association from controls and mutants are shown. Roman numerals indicate the stage of the association determined by acrosome morphology. Arabic numbers indicate the steps of the spermatids. The arrows point to the spermatids used for the determination of the stage of the association. L indicates leptotene spermatocytes and P indicates pachytene spermatocytes. Scale bar: 50 μm. Mean ± SEM are presented in B and C. *, ** and *** indicate p<0.05, p<0.01, and p<0.001, respectively, by two-way ANOVA and Bonferroni post-tests.

