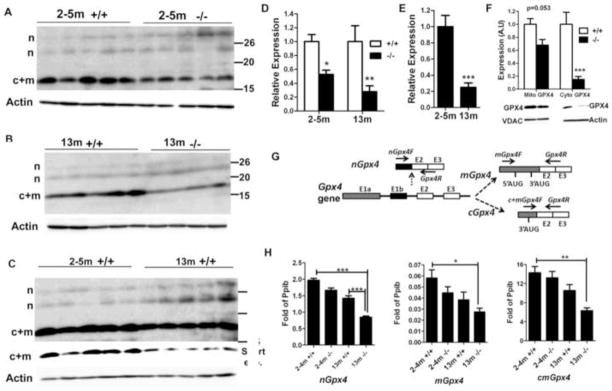
Fig. 4. Analysis of Gpx4 expression at the protein and mRNA levels.
A–C. Western blotting comparison of GPX4 expression between 2-~5-month-old control and mutant mice (A), 13-month-old control and mutant mice (B), and 2-~5-month-old and 13-month-old control mice (C). The expression of c+mGPX4 (c+m) was decreased in mutant mice relative to age-matched control mice, and in old mice relative to young mice. The expression of nGPX4 (n) did not differ among groups. In C, a longer exposure was used to show the relatively weak bands of nGPX4. The row with “short exp.” indicates the result of short exposure time to avoid saturation. D. Densitometry analysis (integrated density by Image J software) of c+mGPX4 protein expression based on A and B. Mean ± SEM for each group is presented. The expression levels of control mice were set as 1. * and ** indicate p<0.05 and p<0.01, respectively by Bonferroni post-tests following two-way ANOVA. E. Densitometry analysis (integrated density by Image J software) of c+mGPX4 protein expression based on C. Mean ± SEM of 5 mice for each group is presented. The expression level of 2-~5-month-old mice was set as 1. *** indicates p<0.001 between 2-~5-month-old and 13-month-old control mice by t-test. F. Reduction of cGPX4 in 13-month-old mutant males. mGPX4 showed only a small reduction, but cGPX4 was significantly reduced in mutants versus controls. Mean ± SEM of 4 mice per group is shown. *** indicates p<0.001 by Bonferroni post-tests following two-way ANOVA. VDAC1 and β-actin were used for loading controls for mitochondrial and cytosolic protein, respectively. Expression of samples from control mice was set as 1. G. Location of primers used for detection of nGpx4, mGpx4, and c+mGpx4. Ten nucleotides from primer Gpx4R pair with exon 2 and 10 nucleotides pair with exon 3. H. Real-time RT-PCR comparison of nGpx4, mGpx4, and c+mGpx4 levels among groups. Pooled cDNA from 5 mice/group was analyzed. Shown is the mean ± SEM of three independent real-time PCR assays. Expression is expressed as fold of internal control gene Ppib. *, ** and *** indicate p<0.05, p<0.01 and p<0.001, respectively, between indicated groups analyzed by Bonferroni post-tests following two-way ANOVA.

