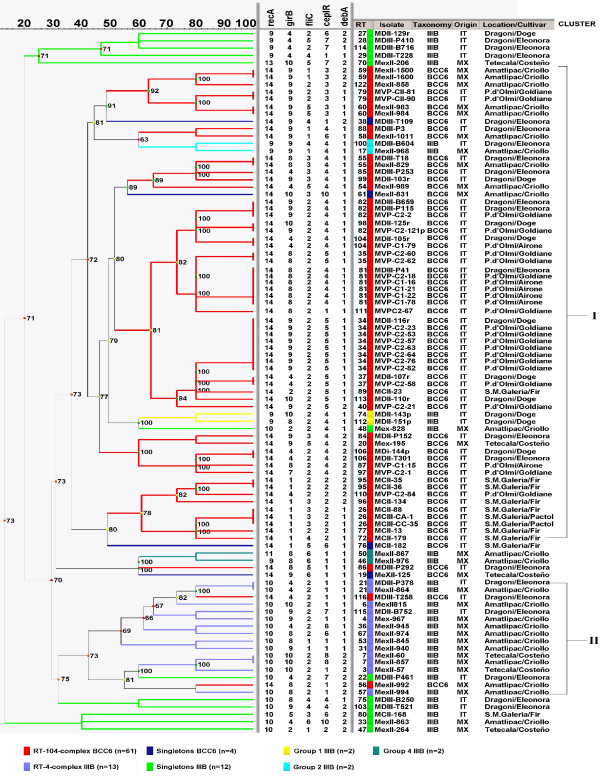
Figure 3.
UPGMA dendrogram generated by BioNumerics software showing the genetic relationships among all B. cenocepacia IIIB and BCC6 isolates. The cophenetic correlation coefficient is shown at each branch, together with a coloured dot, of which the colour ranges between green-yellow-orange-red according to decreasing cophenetic correlation. The Cluster Cutoff method was applied to define the most reliable clusters. The branches found below the cutoff values are shown in dashed lines. Data concerning B. cenocepacia and BCC6 isolates are also included.

