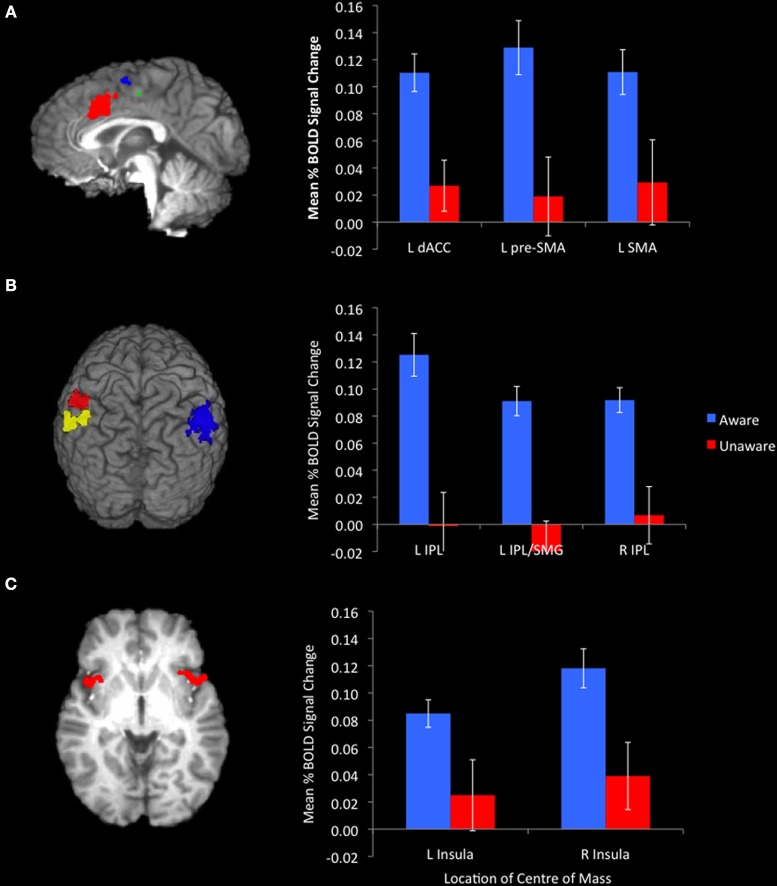
Figure 2.
Awareness of errors was associated with significantly greater activation in midline structures. [(A) sagittal slice at x = −1. Red cluster centered on the dACC, blue cluster centered on the SMA, green cluster centered on the pre-SMA)], the bilateral IPL [(B) red cluster centered on the L-IPL, yellow cluster centered on the L-IPL/SMG, blue cluster centered on the R-IPL], and insulae [(C) axial slice at z = 0]. Bar graphs represent mean %BOLD signal change relative to baseline for aware and unaware errors.

