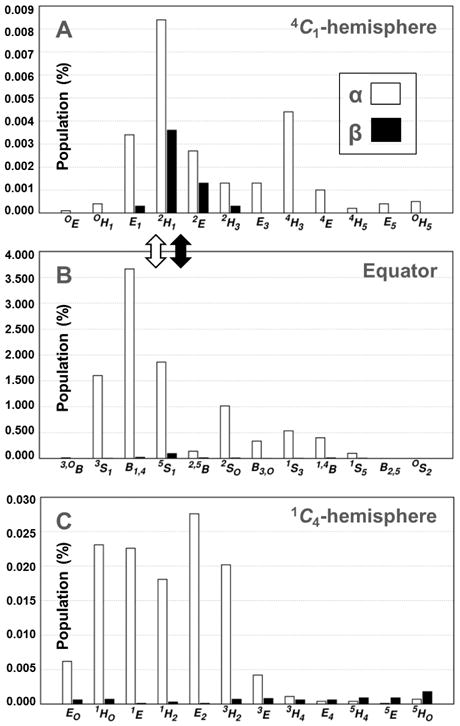
Figure 4.

Histograms showing the occupancy of pyranose puckers for (1) and (2) in the 4C1-hemisphere (A), equatorial region (B) and 1C4-hemisphere (C) during 10 μs simulations (TIP3P water model).
Figure 4 footnote: The most likely transitions (based on pucker populations) between the equator and the 4C1-hemisphere are denoted by arrows. Multiple conformational itineraries between the equator and the 1C4-hemisphere were predicted for (1), e.g., B1,4 ↔ 1E.
