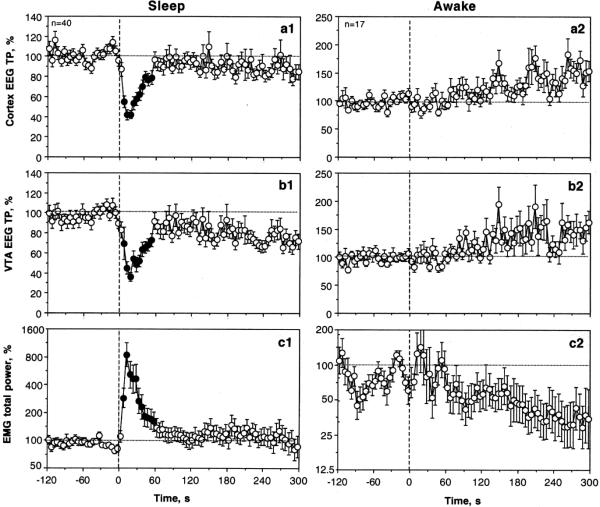
Fig. 1.
The effects of iv saline injection on cortical EEG total power (A), VTA total power (B), and EMG total power (C) shown separately for sleep and active state. Vertical hatched line shows the onset of saline injection. Filled symbols mark values significantly different from pre-injection baseline (at least p<0.05).

