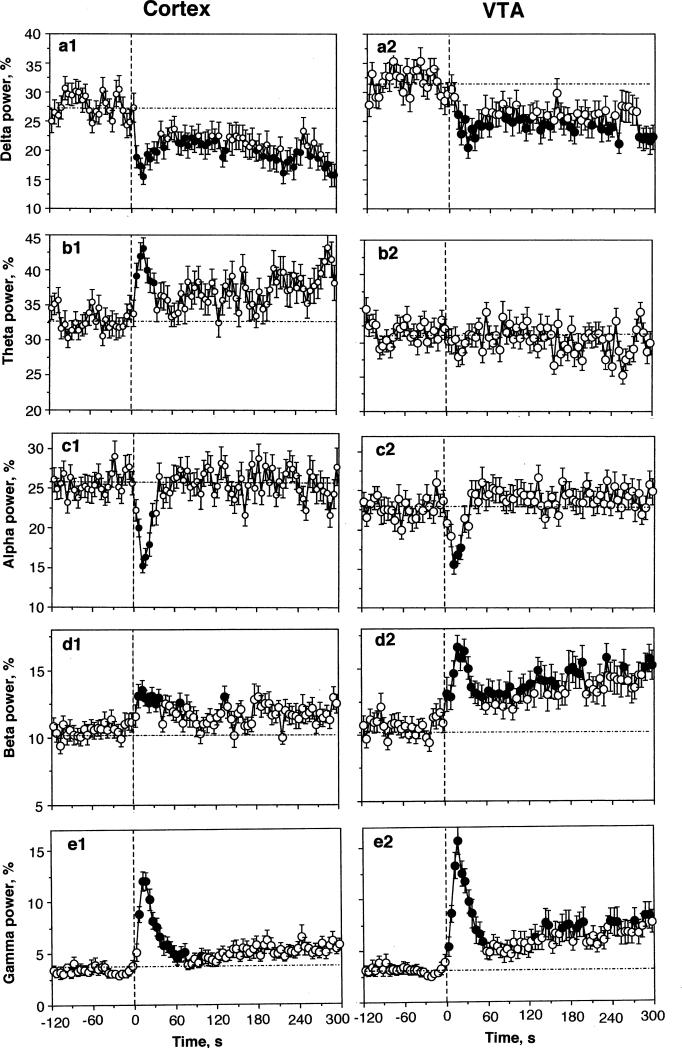
Fig. 2.
Mean changes in individual EEG waves in the cortex and VTA following iv saline injections in slow-wave sleep state. With exception of one case (VTA, theta activity), saline has significant effects on each EEG frequency in both structures (see text). Vertical hatched line shows the onset of saline injection. Values significantly different from pre-injection baseline (at least p<0.05) are shown as filled symbols.

