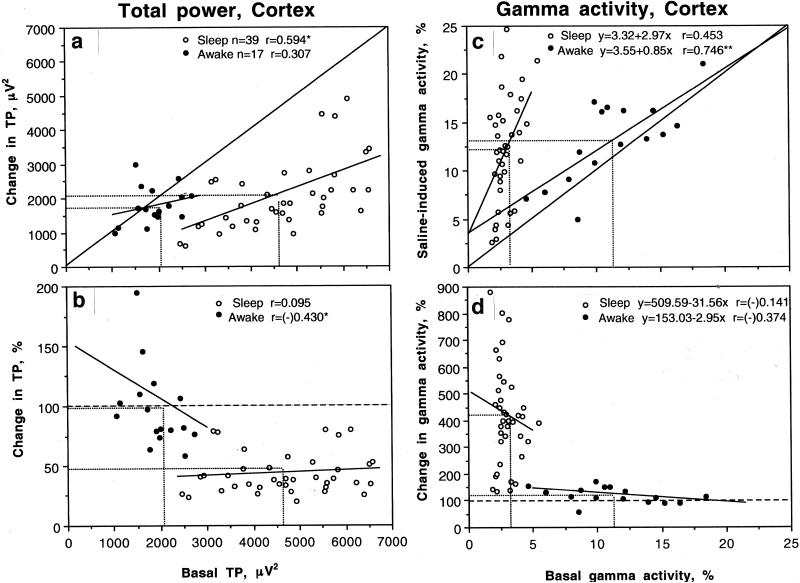
Fig. 3.
The relationships between basal cortical EEG activity and its changes following iv saline injection. A and B show the relationships between absolute values of EEG total power (TP, μV2) and its changes (A, absolute and B, relative) after saline injection during awake (filled symbols) and sleep states (open symbols). C and D show similar relationships calculated for basal gamma power (%) and its changes after saline injection. Basal values of EEG total power and gamma power were calculated for 60-s interval before saline injection. Saline data were calculated as a mean of 4 values (second to fifth data points in Fig. 1, i.e., 5-25 s). Each graph shows line of no effect, regression lines (where correlation is significant) and mean values in each group (hatched lines).

