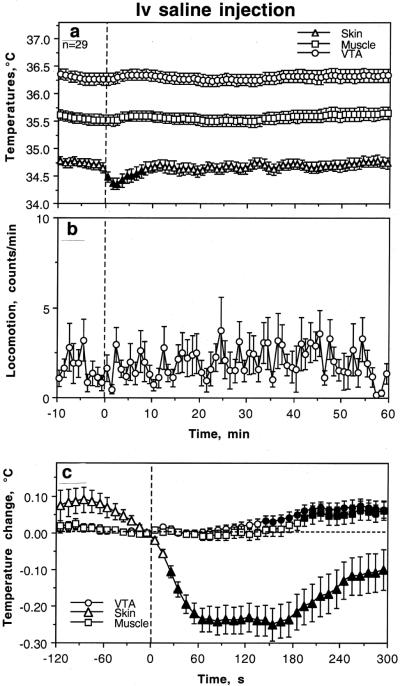
Fig. 4.
Changes in brain (VTA), temporal muscle (Muscle) and facial skin (Skin) temperatures (°C) and locomotion (infrared beams breaks per min) following iv saline injection in freely moving rats in quiet rest. Top two graphs (A and B) show changes at slow time resolution (bin=1 min) for 60 min post-injection. The bottom graph (C) shows changes in VTA, Muscle and Skin temperatures assessed at high temporal resolution (bin=10 s) for the initial five min post-injection. n=number of tests. The values significantly different from pre-injection baseline are shown as filled symbols. The decrease in skin temperature (C) became significant at the third data point (20-30 s) but in the VTA and Muscle the effect was opposite but weak and delayed from the moment of injection (first significant value at 140-150 s and 190-200 s, respectively). Data were obtained in 9 rats (n=29 injections).

