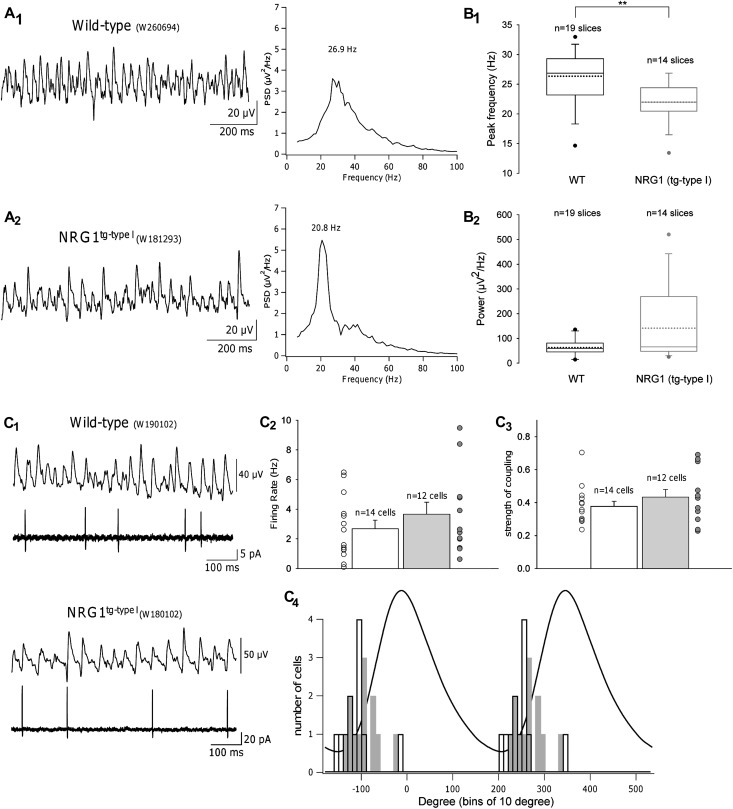
Figure 3.
Altered hippocampal gamma oscillations in NRG1tg-type I mice. (A). Cholinergic activation by carbachol (CCh) induces gamma frequency oscillations in hippocampal slices from wt and NRG1tg-type I mice. One-second-long sample traces (low-pass filtered at 200 Hz) of the recorded field potential oscillations in the hippocampal CA3 pyramidal cell layer and corresponding PSDs in a wt mouse (A1) and a NRG1tg-type I mouse (A2). PSDs, computed for the entire 60-s-long traces, confirm lower peak frequency in the NRG1tg-type I mice. (B) Summary box plots of all recordings demonstrate that peak frequencies (shown in B1) were consistently lower in NRG1tg-type I slices (mean peak frequency in wt: 26.2 ± 1.0 Hz [mean + standard error of the mean] vs. NRG1tg-type I: 22.0 ± 0.9 Hz; P = 0.006**). Whiskers indicate 90th and 10th percentiles of the data; outlying points are also plotted, dotted lines represent the mean. (B2) Mean oscillatory power did not differ between groups (wt: 107.0 ± 44.8 μV2/Hz vs. NRG1tg-type I: 141.4 ± 41.3 μV2/Hz; P = 0.44). (C) CA3 pyramidal cell firing during gamma oscillations. (C1) Representative extracellular field and corresponding cell-attached recordings from slices taken from wt (top) and NRG1tg-type I (bottom) mice. (C2) Histogram comparing the mean firing rate (Hertz) of individual pyramidal cells in wt (black) and NRG1tg-type I (gray) mice, with scatter plots corresponding to their firing rates. Statistical analysis revealed no difference between the groups (wt: 2.70 ± 0.56, NRG1tg-type I: 3.66 ± 0.81; P = 0.36). (C3) Histogram comparing the strength of pyramidal cell firing coupling to the field oscillation in wt (black) and NRG1tg-type I (gray) mice, plus scatter plots representing the coupling values of all individual cells recorded. The average vector length (see Supplementary Materials) did not differ between genotypes (wt: 0.38 ± 0.03; NRG1tg-type I mice: 0.43 ± 0.05; P = 0.38). Error bars in C2 and C3 are standard error of the mean. (C4) Distributions of the mean angles (degrees) at which cells fired relative to the field potential oscillation (wt: 12 cells from 5 mice; NRG1tg-type I: 12 cells from 7 mice). A representative cycle-averaged field oscillation is shown to illustrate phase definition. Firing of pyramidal cells is similarly phase locked to ascending phase of a field gamma cycle in both genotypes with no difference between groups (wt [black]: −111.4° ± 10.0°, NRG1tg-type I [gray]: −93.3° ± 9.2°; P = 0.106).

