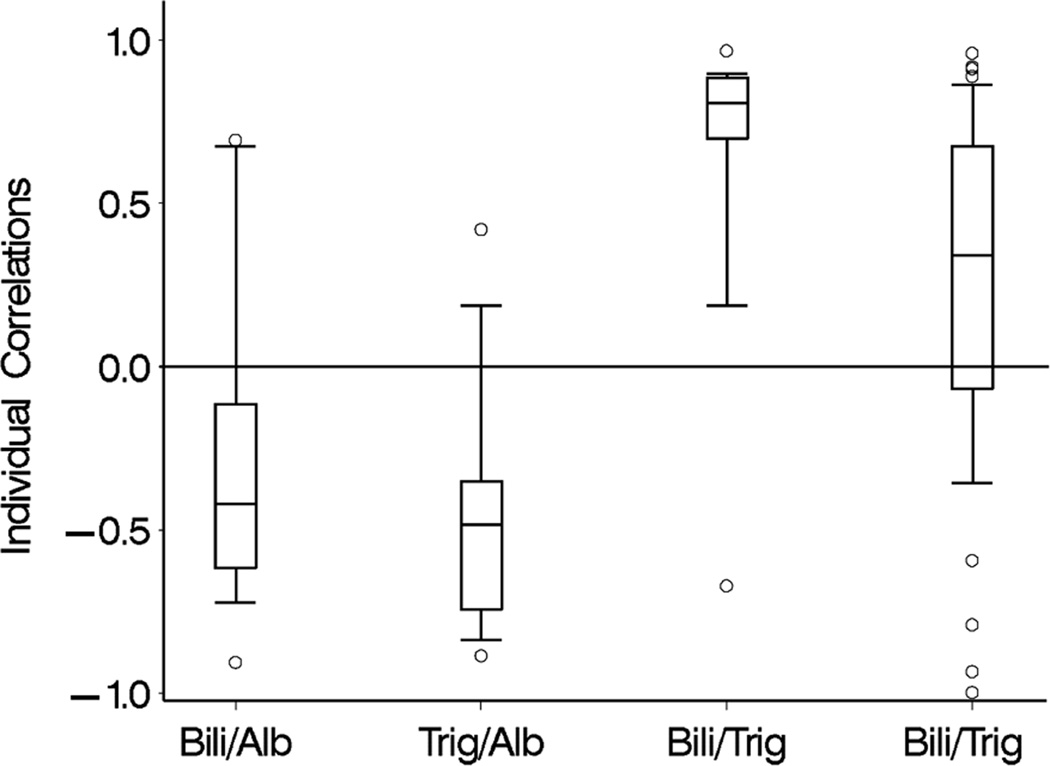
Figure 7.
Distribution of individual Pearson correlation coefficients for pairwise association of triglyceride (TG), direct bilirubin, and albumin in the fish oil cohort and TG and albumin in the soybean oil cohort. The solid bar within the box represents the median value, upper boundary- 75th percentile, lower boundary- 25th percentile; whiskers extend from the 10th–90th percentiles. Correlation of TG with direct bilirubin in the soybean oil cohort excluded 6 subjects who had 1 or less pair of observations and 12 subjects who had 2 pairs of observations (9 with correlation + 1 and 3 with correlation −1).

