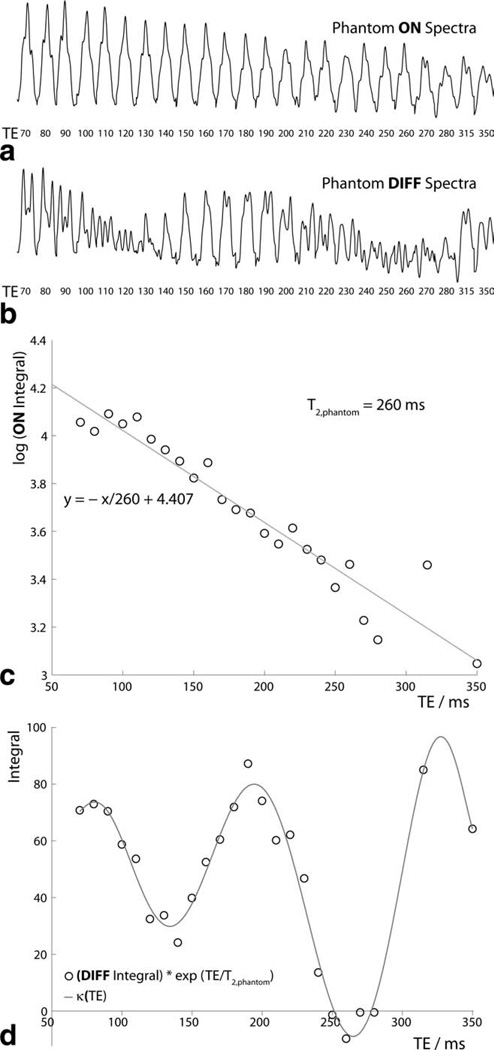
Figure 2.
Phantom experiments. a: ON spectra and (b) DIFF spectra are plotted from 2.89 ppm to 3.14 ppm for TEs from 70 ms to 350 ms. c: Plot of log of ON integrals against TE, allowing determination of T2,phantom. d: Plot of DIFF integrals (with T2-weighting removed) against TE, allowing determination of κ(TE).

