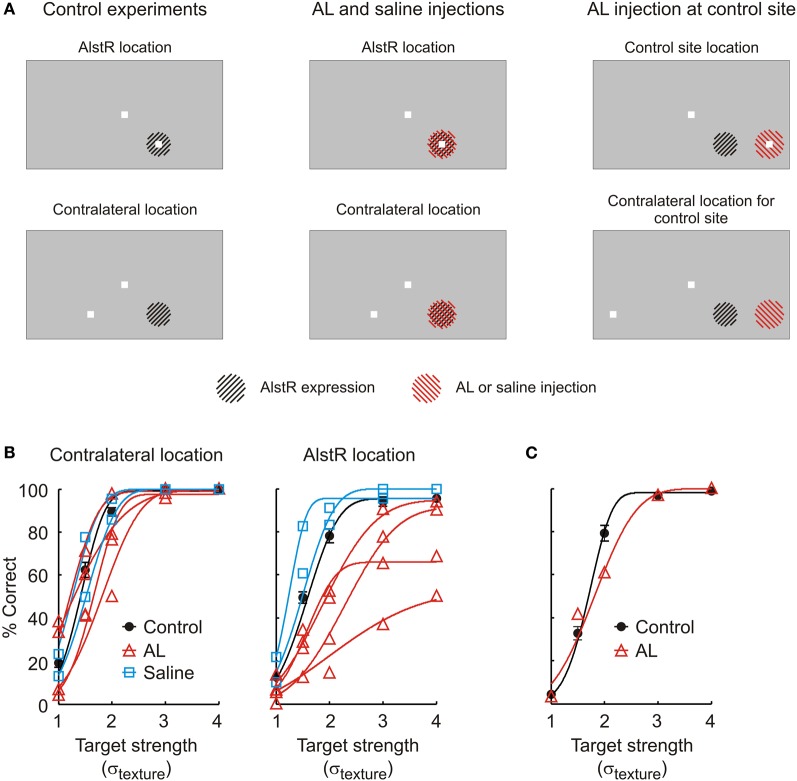
Figure 2.
(A) Overview over the different experimental conditions. Left: Stimulus configuration in control experiments. The top and bottom panels indicate the two different target locations for which the monkey's performance is shown in (B). The region hatched in black indicates the part of the visual field represented by neurons expressing the AlstR (not drawn to size). Middle: The same stimulus configuration was used when injecting AL or saline at the V1 site expressing the AlstR. In these panels, the region hatched in red represents the part of the visual field targeted by the fluid injection (not drawn to size). Right: In one experiment, AL was injected at a V1 site not expressing the AlstR. (B) Performance of monkey W in the detection task. The graph on the left plots behavior for targets shown at the contralateral location; the graph on the right the behavior for targets shown at the AlstR location. Black circles: Average performance in control experiments without injection (error bars: SEM). Black line: Average psychometric function fit to the control data. Red lines and triangles: Performance in individual AL injection experiments (triangles: raw data; lines: psychometric function fit to the different injection experiments). Blue squares and lines: Performance (raw data and fit) during saline injection. (C) Performance during AL injection at a V1 site not expressing the AlstR. The target was placed to fall into the receptive field locations at this site (marked as “control site location” in A). Black circles and line: Average behavior and psychometric function in control experiments without injection (error bar: SEM). Red triangles and line: Performance (raw data and fit) during AL injection.

