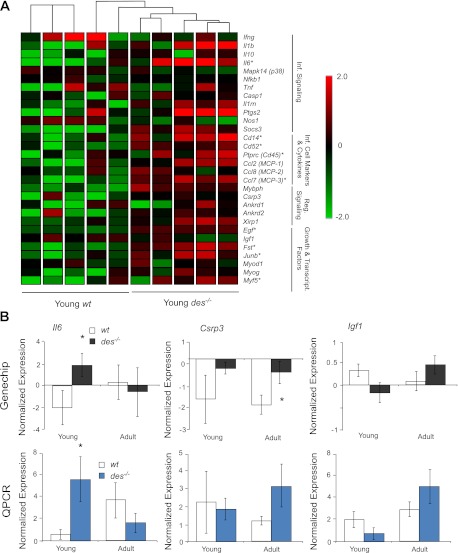
Fig. 6.
Young des−/− muscle showed increased inflammation and regeneration specific gene expression. A: normalized gene expression for 18 genes involved in inflammation signaling and inflammatory cell migration and 11 genes involved in regeneration shown on a colored scale with green representing low expression and red representing high expression. Hierarchical clustering is represented by connecting lines at top of the grid with lines closest to the grid noting the most similar samples. The clustering algorithm separated samples according to genotype with young des−/− to at right, indicating that young des−/− samples had a distinct expression pattern of inflammation/regeneration genes compared with wt. Young des−/− samples showed higher expression of the majority of the listed genes. *Significantly higher expression values, as determined by two-way ANOVA. B: normalized expression as determined by GeneChip and qPCR for three important inflammation/regeneration genes: Il6 (interleukin 6), Csrp3 (muscle LIM protein), and Igf1 (insulin like growth factor). Consistent with GeneChip data, qPCR revealed significantly higher expression for Il6 in the young des−/− muscle. *P < 0.05.

