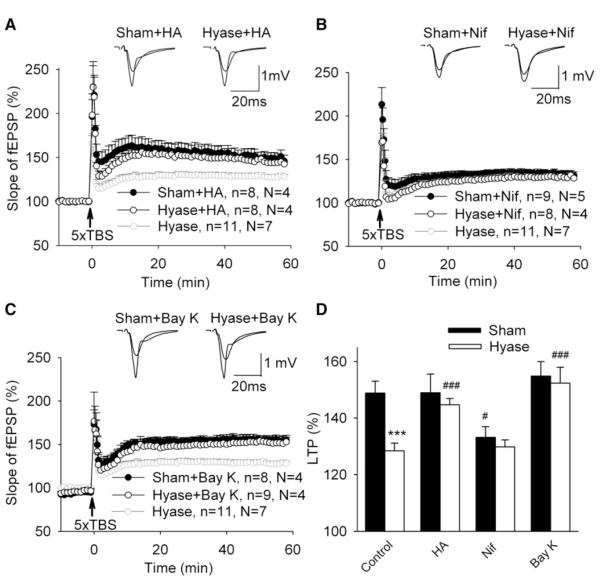
Figure 3. The Effect of Hyaluronidase on LTP Is Rescued by Hyaluronic Acid and Requires Activity of L-VDCCs.
(A–C) The mean slope of fEPSPs recorded 10 min before 5×TBS was taken as 100%, and arrows indicate delivery of 5×TBS. Data represent means + SEM; n and N provide the numbers of tested slices and mice, respectively. Each trace is the average of 30 fEPSPs recorded 10 min before or 50–60 min after 5×TBS. To better illustrate effects of HA, nifedipine, and Bay K 8644, LTP recorded in Hyase-treated slices without these compounds is shown in gray.
(A) Restoration of impaired LTP in Hyase-treated slices by incubation with HA.
(B) LTP is reduced to the same levels in sham- and Hyase-treated slices in the presence of 10 μM nifedipine.
(C) LTP induced in Hyase-treated slices in the presence of 15 μM Bay K 8644 is restored to normal levels.
(D) Means + SEM of LTP levels recorded 50–60 min after 5×TBS. The bars show impaired LTP after Hyase and nifedipine treatments and restored LTP by HA or Bay K 8644 after Hyase treatment. ***p < 0.001, significant difference between control and Hyase-treated slices; #p < 0.05, significant effect of nifedipine on sham-treated slices; ###p < 0.001, significant effects of HA and Bay K 8644 on Hyase-treated slices, unpaired t test. See also Figure S3.

