Figure 3.
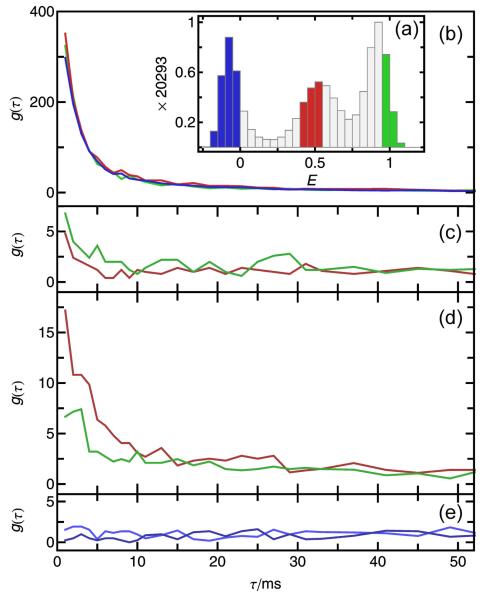
Subpopulation-specific burst time correlations. Bursts were selected from transfer efficiency ranges reflecting the unfolded (red), folded (green), or acceptor-inactive (blue) subpopulations, as shown in the FRET efficiency histogram (a). (Note that values of E >1 or <0 are due to corrections for background and direct acceptor excitation. For details see Ref.9) Colors in panels b-e indicate the E range of the initial bursts. (b) Subpopulation-specific autocorrelations exhibit large amplitudes, reflecting the high probability of recurrence. The cross-correlations between folded and unfolded subpopulations (c) yield small but significant amplitudes, which may reflect an imperfect separation of the subpopulations for the E ranges in (a). Acceptor photobleaching results in significant amplitudes of the cross-correlation from acceptor-active to -inactive subpopulations (d). (e) No cross-correlation from acceptor-inactive to -active subpopulations is observed, showing that blinking processes do not occur on the recurrence time scale.

