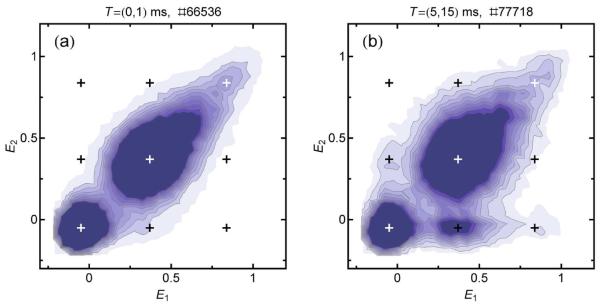
Figure 8.
Recurrence E contour plots of CspTm in 3.5 M GdmCl and 50% ethylene glycol. The broad peak from unfolded molecules suggests pronounced heterogeneity, in addition to a small peak from folded molecules at E ≈ 0.9. Black and white crosses indicate the mean transfer efficiencies of the subpopulations and possible cross-peaks. The recurrence intervals and the total numbers of burst pairs are indicated above the graphs.

