Figure 9.
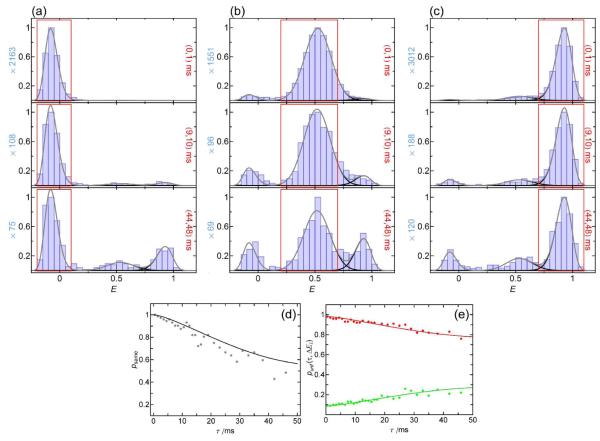
Representative recurrence E histograms of CspTm in 1.1 M GdmCl for different recurrence times and subpopulation-specific ΔE1 ranges (acceptor-inactive in a, unfolded in b, and folded in c; the recurrence intervals are indicated in each panel with red frames). For all three ΔE1 ranges, the two other populations slightly increase over time. The appearance of the acceptor-active population in (a) can be used directly to calculate psame (d, gray points) and is compared to psame calculated from the burst autocorrelation (Eq. 2, black line), showing the good agreement between both methods. The fractions of unfolded molecules punf(τ) for recurrence E histograms starting from unfolded (b) and folded (c) molecules (red and green points, e) were globally fit with a model including both folding/unfolding of recurring molecules and appearance of new molecules (continuous lines). The fit is indistinguishable from what is expected for the occurrence of new molecules only, which shows that the contribution from folding dynamics is negligible in this case.

