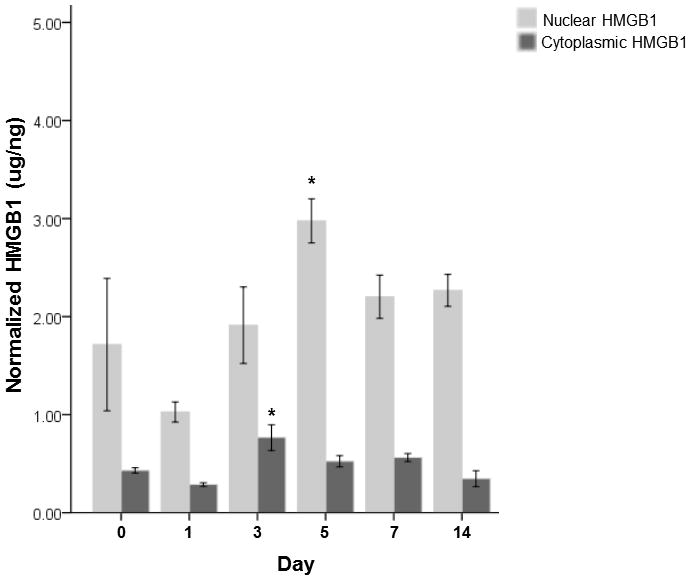
Figure 3. Nuclear and cytoplasmic HMGB1 protein levels normalized to the total protein level in the tissue samples following vocal fold surgical injury.

HMGB1 concentrations are in ug/ng. The bars and the error bars represent the mean and the standard errors of the data (n=18), representatively. Asterisks * denotes the data of that time point is statistically significant compared to the uninjured controls.
