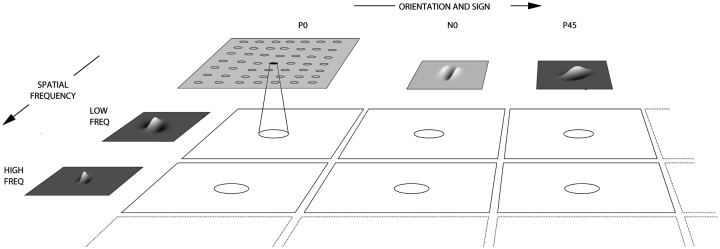
Figure 11.
The filter sampling paradigm. Here each square represents the retinal image presented to the network after being filtered by a Gabor filter of the appropriate orientation sign and frequency. The circles represent the consistent retinotopic coordinates used to provide input to a layer 1 cell. The filters double in spatial-frequency toward the reader. Left to right the orientation tuning increases from 0° in steps of 45°, with segregated pairs of positive (P) and negative (N) filter responses.

