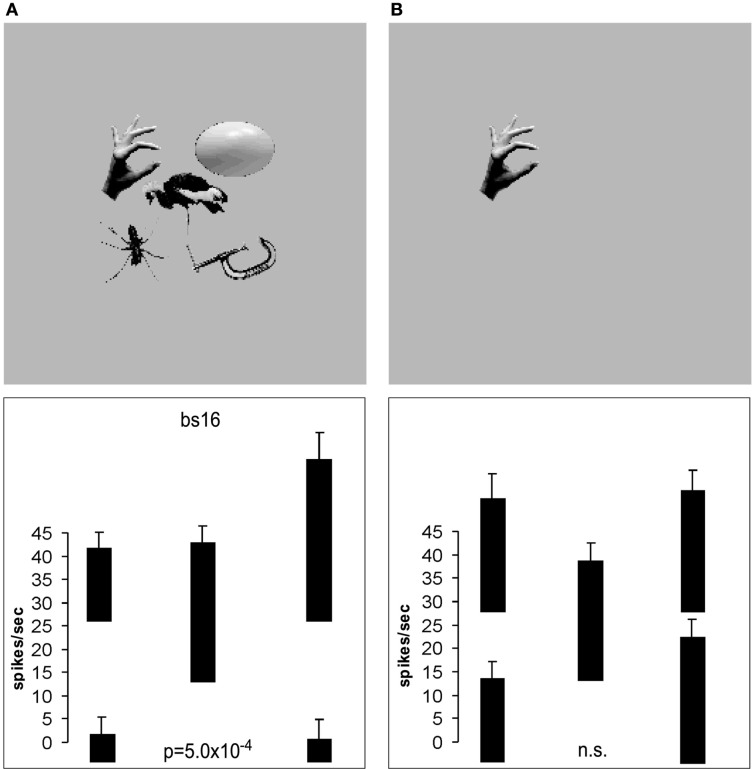
Figure 35.
(A) The responses (firing rate with the spontaneous rate subtracted, means ± sem) of an inferior temporal cortex neuron when tested with 5 stimuli simultaneously present in the close (10°) configuration with the parafoveal stimuli located 10° from the fovea. (B) The responses of the same neuron when only the effective stimulus was presented in each position. The firing rate for each position is that when the effective stimulus (in this case the hand) for the neuron was in that position. The p value is that from the ANOVA calculated over the four parafoveal positions. (After Aggelopoulos and Rolls, 2005.)

