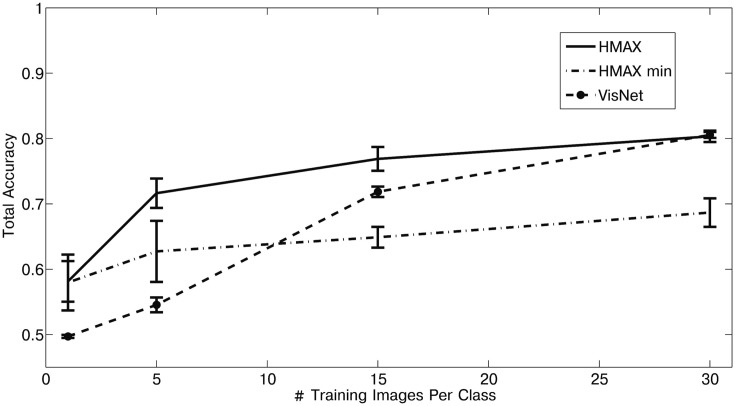
Figure 43.
Performance of VisNetL, HMAX, and HMAX_min on the classification task using the Caltech-256 dataset. The error bars show the standard error of the means over 5 cross-validation trials with different images chosen at random for the training set on each trial. It is clear that VisNetL performs better than HMAX_min, and this was confirmed statistically using the Chi-square test performed with 30 training images and 30 cross-validation test images in each of two categories (Chi-square = 8.09, df = 1, p = 0.0025).

