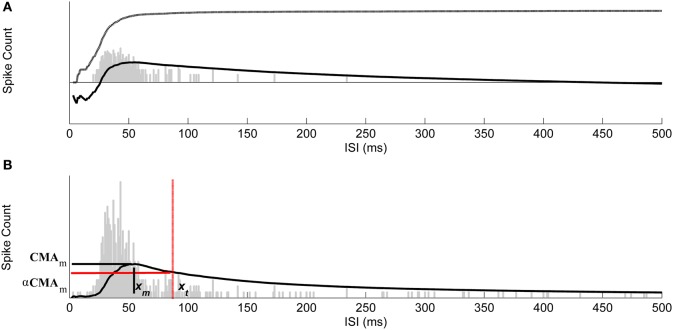
Figure 3.
Selecting thresholds for burst ISIs by using CMA curve. (A) The ISI histogram (gray bars), cumulative histogram (dash-dotted), and the corresponding CMA curve (solid). Vertical axis is logarithmic. (B) Maximum value of CMA curve, CMAm, is reached at the ISI xm and the ISI threshold xt for bursting was found at the ISI corresponding to the CMA value closest to α·CMAm. The ISI threshold for burst detection is marked with red dash-dotted vertical line. Vertical axis is linear and thus the cumulative histogram is not shown.

