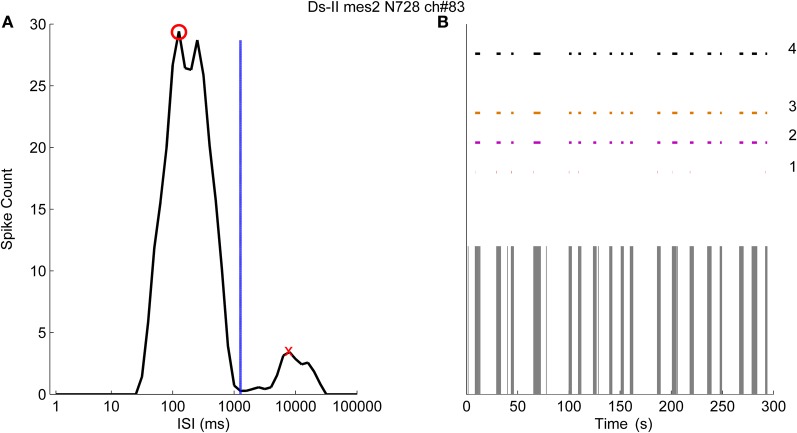
Figure 7.
The logarithmic ISI histogram of a channel with well separated inter- and intra-burst ISIs. (A) Logarithmic histogram (black solid line) has two different peaks where red circle shows the principal peak and the red cross shows the secondary peak. Threshold for the burst boundary spikes is calculated to occur at 1259 ms (blue dashed line). (B) Burst detection results of logISIH method by employing the burst core and principal peak thresholds at 100, 200, and 1000 ms are labeled as 1, 2, and 3 respectively. The result of the CMA algorithm is labeled as 4.

