Figure 1.

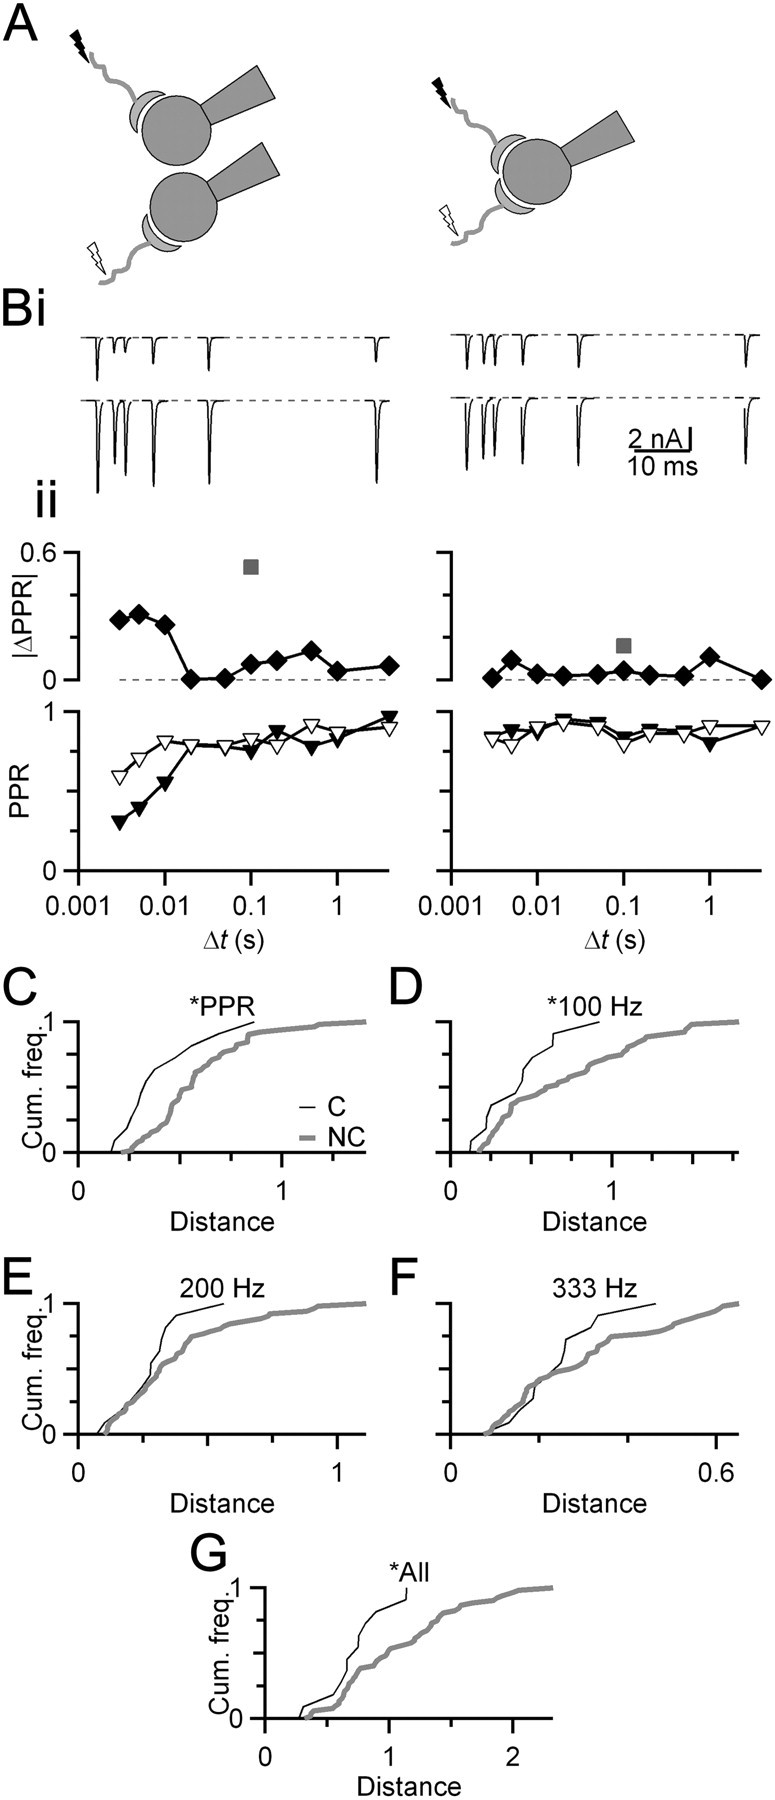
Converging inputs are similar. A, Diagram of experimental arrangement. EPSCs were recorded for AN fiber synapses that converge on the same BC or onto different BCs. B, Representative voltage-clamp experiments of converging and nonconverging endbulb EPSCs. Bi, EPSCs resulting from stimulating individual inputs (top vs bottom traces) at different paired-pulse intervals. Bii, Quantification of short-term plasticity using the PPR (EPSC2/EPSC1). PPR for individual endbulbs is shown by triangles (bottom). The absolute difference between these two curves is plotted and shown by diamonds (top). The square root of the sum of squares of these values is termed the distance between the endbulbs (gray squares). C–G, Cumulative frequency histograms of distances between PPR of converging (black) and nonconverging (gray) endbulbs (C), or using a similar analysis for trains of 20 stimuli at 100 (D), 200 (E), or 333 (F) Hz. An overall distance incorporating all PPR and train measures is shown (G). The distributions in C, D, and G are significantly different (Kolmogorov–Smirnov test, p < 0.05; NC = 12 pairs; NNC = 53 pairs). Slices are from mice aged P18–P21.
