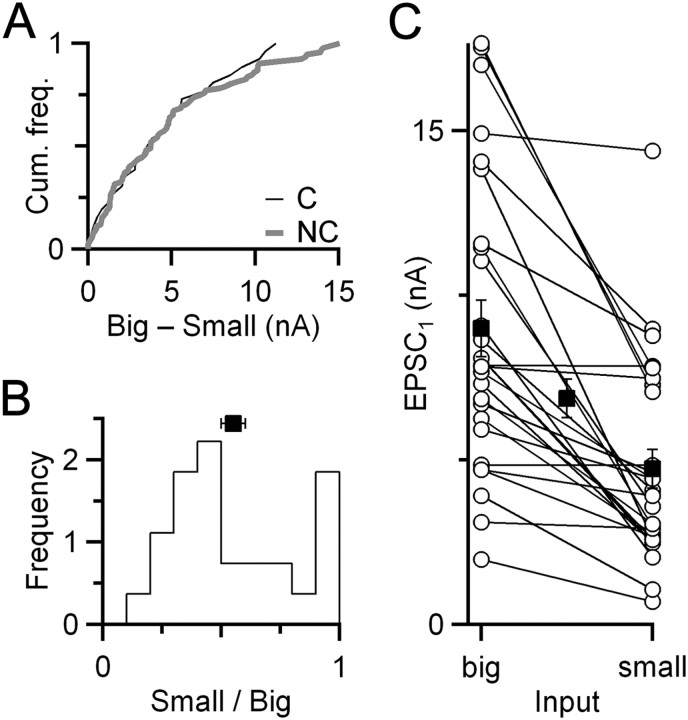
Figure 2.
Coordinated plasticity is not reflected in similarity in EPSC1. A, Cumulative frequency histogram of difference in EPSC1 for converging versus nonconverging inputs. There is no significant difference (p > 0.95, Kolmogorov–Smirnov test; NC = 27 pairs, NNC = 93 pairs). B, Relative amplitudes of converging endbulbs (NC = 27 pairs). The relatively smaller input is scaled to the larger one. The population average is indicated by the square (mean ± SEM). C, Relationships between the absolute EPSC1 amplitudes for converging endbulbs. Open circles indicate amplitudes of individual endbulbs. Converging endbulbs are connected by lines. Closed squares indicate average amplitudes of relatively larger and smaller endbulbs in the pair and the overall average (middle square).

