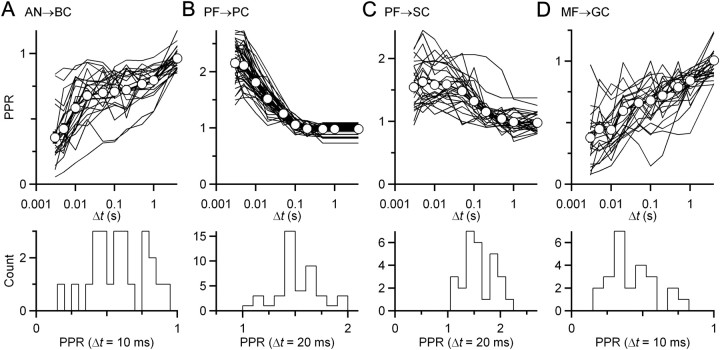
Figure 6.
Plasticity in each population of recorded cells is unimodally distributed. A–D, Top, Paired pulse recovery curves for all characterized synapses [AN to BC (AN → BC) (A), mossy fiber to granule cell (MF → GC) (D)] or pathways (PF → PC) (B), parallel fiber to stellate cell (PF → SC) (C)]. Each line represents a separate synapse or pathway. Open circles and bold lines are population averages. There is considerable variability in plasticity across each population. Bottom, Representative histograms at individual time intervals when plasticity is particularly strong. No measure shows multiple modes, suggesting that each group of recordings is drawn from an effectively uniform population.

