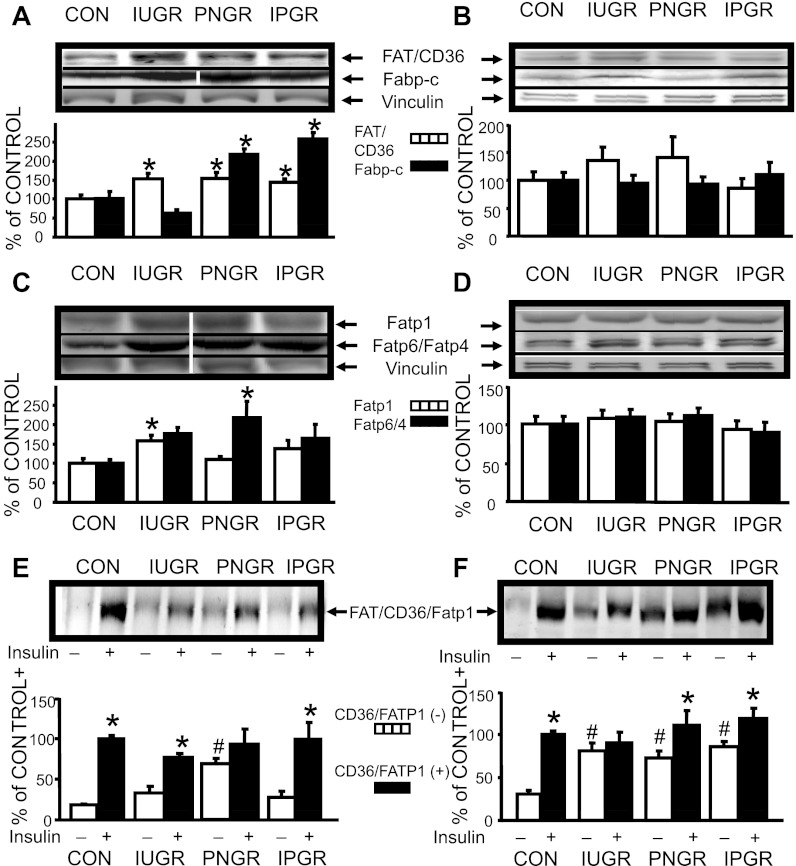
Fig. 1.
Myocardial and skeletal muscle fatty acid transporter proteins (FATP). A: myocardial FAT/CD36 and cytoplasmic fatty acid binding protein (FABP-c) proteins. Top: representative Western blots of FAT/CD36, FABP-c with vinculin (internal control) proteins. Samples from control (CON) and intrauterine growth restriced (IUGR) are from noncontiguous lanes from that of the postnatal growth-restricted (PNGR) and combined (IPGR) samples, as shown by white dividing line. Bottom: densitometric quantification of FAT/CD36-vinculin and FABP-c-vinculin protein concentrations expressed as %ON in all 4 experimental groups: CON (n = 6), IUGR (n = 6), PNGR (n = 6), and IPGR (n = 6) at day 60. Fisher's PLSD = *P < 0.05 vs. CON. B: skeletal muscle FAT/CD36 and FABP-c proteins: Top: representative Western blots of FAT/CD36, FABP-c, and vinculin (internal control) proteins. Bottom: densitometric quantification of FAT/CD36-vinculin and FABP-c-vinculin protein concentrations expressed as %CON in all 4 experimental groups: CON (FAT/CD36 n = 8; FABP-c n = 6), IUGR (n = 9, 6), PNGR (n = 9, 6), and IPGR (n = 9, 6) at day 60. C: myocardial FATP1 and FATP6 proteins. Top: representative Western blots of FATP1, FATP6, and vinculin (internal control) proteins. Samples from CON and IUGR are from noncontiguous lanes from that of PNGR and IPGR samples, as shown by white dividing lines. Bottom: densitometric quantification of FATP1-vinculin and FATP6-vinculin protein concentrations expressed as %CON in all 4 experimental groups: CON (n = 6), IUGR (n = 6), PNGR (n = 6), and IPGR (n = 6) at day 60. Fisher's PLSD = *P < 0.05 vs. CON. D: skeletal muscle FATP1 and FATP4 proteins: Top: representative Western blots of FATP1, FATP4, and vinculin (internal control) proteins. Bottom: densitometric quantification of FATP1-vinculin and FATP4-vinculin protein concentrations expressed as %CON in all 4 experimental groups: CON (n = 9), IUGR (n = 9), PNGR (n = 9), and IPGR (n = 9) at day 60. E: myocardium sarcolemmal FAT/CD36 protein. Top: representative Western blot of FAT/CD36 in the absence (−) and presence (+) of insulin stimulation in all 4 experimental groups. Bottom: densitometric quantification of FAT/CD36 protein concentrations in the absence (−) and presence (+) of insulin stimulation expressed as %CON (+) in CON (n = 6), IUGR (n = 6), PNGR (n = 6), and IPGR (n = 6) at day 60. Fisher's PLSD = *P < 0.05 vs (−), #P < 0.05 vs. CON (−). F: myocardium sarcolemmal FATP1 protein. Top: representative Western blot of FATP1 in the absence (−) and presence (+) of insulin stimulation in all 4 experimental groups. Bottom: densitometric quantification of FATP1 protein concentrations in the absence (−) and presence (+) of insulin stimulation expressed as %CON (+), in CON (n = 6), IUGR (n = 6), PNGR (n = 6), and IPGR (n = 6) at day 60. Fisher's PLSD = *P < 0.05 vs. (−), #P < 0.05 vs. CON (−).

