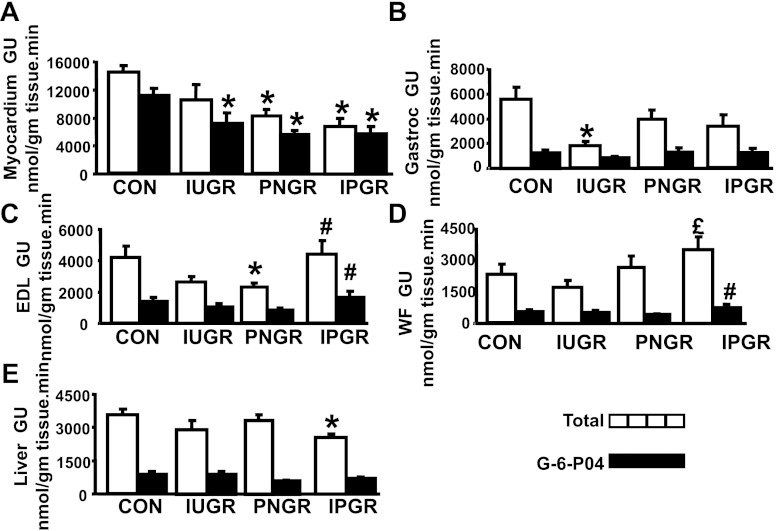
Fig. 5.
Basal tissue 2-deoxy-[14C]glucose uptake. A–E: basal total deoxy-[14C]glucose uptake and [14C]glucose 6-phosphate content expressed in nmol·g tissue−1·min−1 is depicted in myocardium (A), gastrocnemius (B), EDL (C), WF (D), and liver (E) in all 4 experimental groups: CON (n = 6), IUGR (n = 6), PNGR (n = 6), and IPGR (n = 6) at day 60. Solid bars, total deoxy-[14C]glucose uptake (GU); stippled bars, phosphorylated deoxy-[14C]glucose content. Fisher's PLSD = *P < 0.05 vs. CON, £P < 0.05 vs. IUGR, #P < 0.05 vs. PNGR.

