Fig. 1.
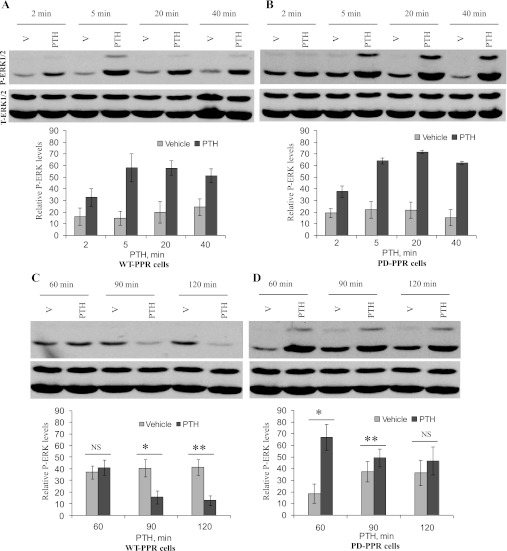
Differential regulation of extracellular signal-regulated kinase (ERK) 1/2 in LLCP-K1 cells stably expressing a wild-type (WT-PPR) or a phosphorylation-deficient (PD-PPR) parathyroid hormone/parathyroid hormone-related peptide receptor. A and B: PD-PPR cells activate ERK1/2 normally in response to short parathyroid hormone (PTH) treatment. The WT-PPR and PD-PPR cells were serum starved for 1 h and then treated with 10 nM PTH for 0–40 min at 37°C. At the end of the incubation, the cells were placed on ice, washed 2× with ice-cold PBS, and lysed in SDS sample buffer. The cell lysates were analyzed on 8% SDS-PAGE. The samples were transferred to a nitrocellulose membrane and blotted with anti-phospho (active)-ERK1/2 antibody and a peroxidase-conjugated secondary antibody (blot on top). Detection was done with chemiluminescence, and the membranes were exposed to a film for 0.5 min. The blots were stripped and reprobed with anti-total (active and inactive) ERK1/2 antibody (blot on bottom). Representative images are displayed from one experiment. The respective graphs represent Western blot band densities of the 42-kDa phosphor-ERK2 (P-ERK) relative to its own total-ERK2 (T-ERK). The graphs are representative of results from 4 independent experiments; two experiments were performed in the green fluorescent protein (GFP)-tagged PPR cell lines and two in the untagged PPR cell lines. The data are expressed as means ± SD. C and D: PD-PPR cells show prolonged activation of ERK1/2 in response to long PTH treatment. The WT-PPR and PD-PPR cells were serum starved for 1 h and then treated with vehicle or 10 nM PTH (1–34) for 60, 90, and 120 min at 37°C. At the end of the incubation, the cells were processed for Western blot with anti-phospho ERK1/2 antibody (blot on top) and then with anti-total ERK1/2 antibody (blot on bottom) as described in A and B. Representative images are displayed from one experiment. The respective graphs represent Western blot band densities of the 42-kDa P-ERK relative to its own T-ERK. The graphs are representative of results from 4 independent experiments; two experiments were performed in the GFP-tagged PPR cell lines and two in the untagged PPR cell lines. V, vehicle. Data are expressed as means ± SD. Bars with * or ** indicate a P < 0.05 compared with its own vehicle control. NS indicates no significance with a P > 0.05.

