Fig. 5.
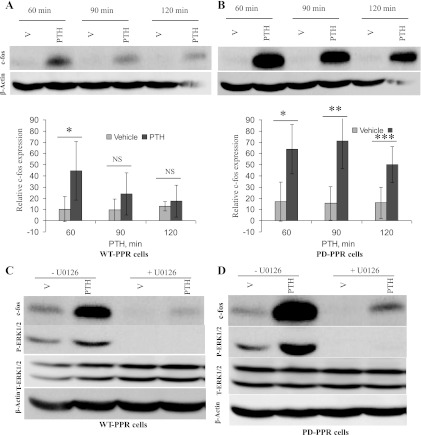
Enhanced c-fos expression in PD-PPR cells. A and B: PD-PPR cells show higher PTH stimulation of c-fos expression than the WT-PPR cells. The WT-PPR and PD-PPR cells were treated with PTH (10 nM for 60–120 min). The cells were then lysed and processed for Western blot analysis as described in Fig. 1 but using rabbit anti-c-fos antibody (blots on top). The blots were also stripped and reprobed with anti-β-actin antibody for loading control (blots on bottom). Representative images are displayed from one experiment. The respective graphs represent Western blot band densities of c-fos relative to β-actin. The graphs are representative of results from 3 independent experiments; two experiments were performed in the GFP-tagged PPR cell lines and one in the untagged PPR cell line. The data are expressed as means ± SD. Bars with *, **, or *** indicate a P < 0.05 compared with its own vehicle control. NS indicates no significance. C and D: c-fos expression is attenuated by inhibition of the ERK1/2 pathway in the WT-PPR and PD-PPR cells. The WT-PPR and PD-PPR cells were treated with PTH (10 nM for 60 min) in the presence or absence of the ERK1/2 pathway inhibitor U-0126 (4 μM). The cells were then lysed and analyzed for c-fos expression (first panels on top) using Western blot, as described above. The blots were also stripped and reprobed with anti-phospho-ERK1/2 antibody to ensure inhibition of the ERK1/2 pathway (second panels on top), anti-total-ERK1/2 antibody (third panels on top), and last with anti-β-actin antibody (panels on bottom). This experiment was repeated 3 times with similar results; two experiments were performed in the GFP-tagged PPR cell lines and one in the untagged PPR cell line.

