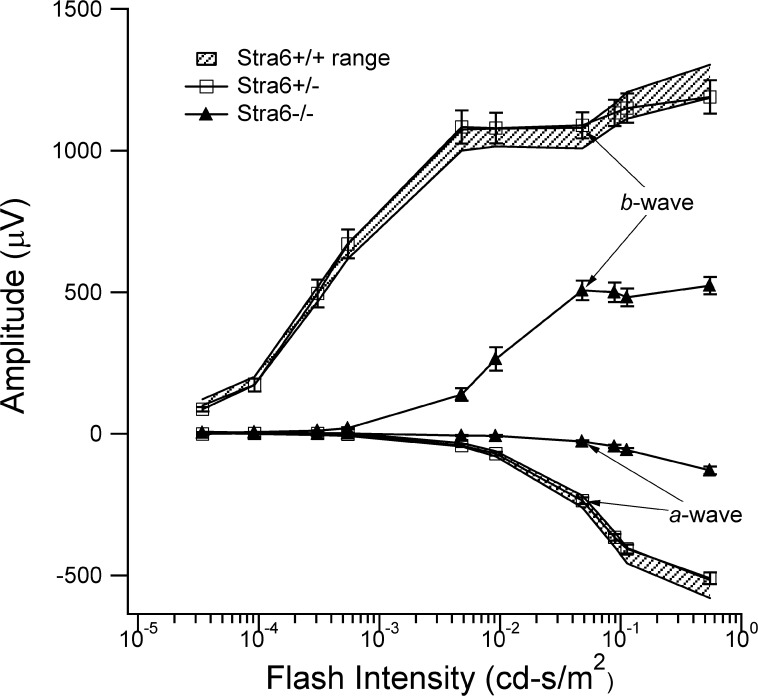
Figure 9.
ERG analysis of 6-week-old stra6 mice. ERG responses to blue-flash stimuli recorded under dark adapted conditions are shown for each group of mice. The shadowed regions define the normal ranges for a- and b-wave amplitudes for WT stra6 +/+ mice. The responses from heterozygous stra6 +/− mice fell completely within this range, consistent with normal retinal function. In contrast, ERG responses from stra6 −/− mice were significantly smaller, with a- and b-wave amplitudes approximately 20% and 50%, respectively, of WT control and heterozygous mice. ERG analysis of 5-month-old stra6 mice showed similar visual responses as the 6-week-old mice (data not shown).

