Figure 2.

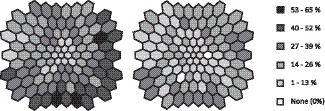
Retinal view in left-eye format showing the occurrence of implicit time abnormalities (z score ≥ 2) at each location in the stimulus array for the diabetic males (left) and the diabetic females (right).

Retinal view in left-eye format showing the occurrence of implicit time abnormalities (z score ≥ 2) at each location in the stimulus array for the diabetic males (left) and the diabetic females (right).