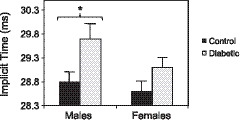
Figure 3.

Average whole eye implicit times. Bars indicate 1 SE. The males with type 2 diabetes (29.7 ± 0.3 ms) had significantly longer latencies (*P = 0.011) than the control males (28.8 ± 0.2 ms). The implicit times of the females with type 2 diabetes (29.1 ± 0.2 ms) were similar to the control females (28.6 ± 0.2 ms).
