Fig. 7.
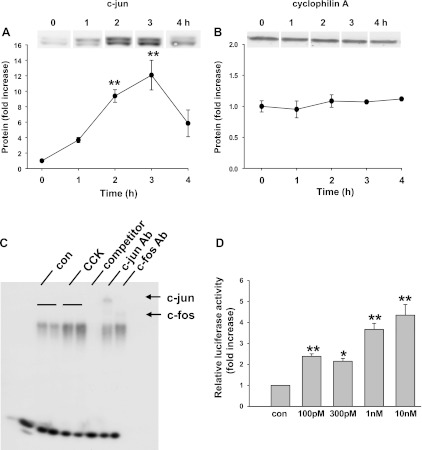
Induction of c-Jun expression and AP-1 activation by CCK in cultured acinar cell. A and B: acinar cells were cultured for 24 h and then were stimulated with 1 nM CCK for the indicated time. c-Jun protein induction was measured (A), while cyclophilin A was used as control (B). Pooled data are means ± SE of 4–6 individual experiments and expressed as fold increase of non-CCK-treated control. **P < 0.01; *P < 0.05 compared with the values at time 0, non-CCK-treated control. C: acinar cells were cultured for 24 h followed by treatment with 1 nM CCK for 3 h. The DNA binding activity of AP-1 was examined by EMSA. Specificity of AP-1 DNA binding was determined by addition of excess of 50-fold unlabeled AP-1 consensus sequence (competitor). Supershift EMSA was performed using antibody to c-Jun. The results are representative from at least 3 independent experiments. D: AP-1 driven luciferase construct was delivered into acinar cells by adenoviral vector 1 h before CCK administration. The cells were stimulated with the designated concentration of CCK for 6 h. Relative luciferase activity was measured and the results were expressed as fold increase compared with the control non-CCK-treated group. Pooled data are means ± SE of 4 experiments. For A and B, duplicate culture wells were run on gels and imaged, and after quantification the image was spliced to show only 1 lane per condition as described in materials and methods. For this reason a white line is placed between the lanes. **P < 0.01; *P < 0.05 compared with the non-CCK-treated control group.

