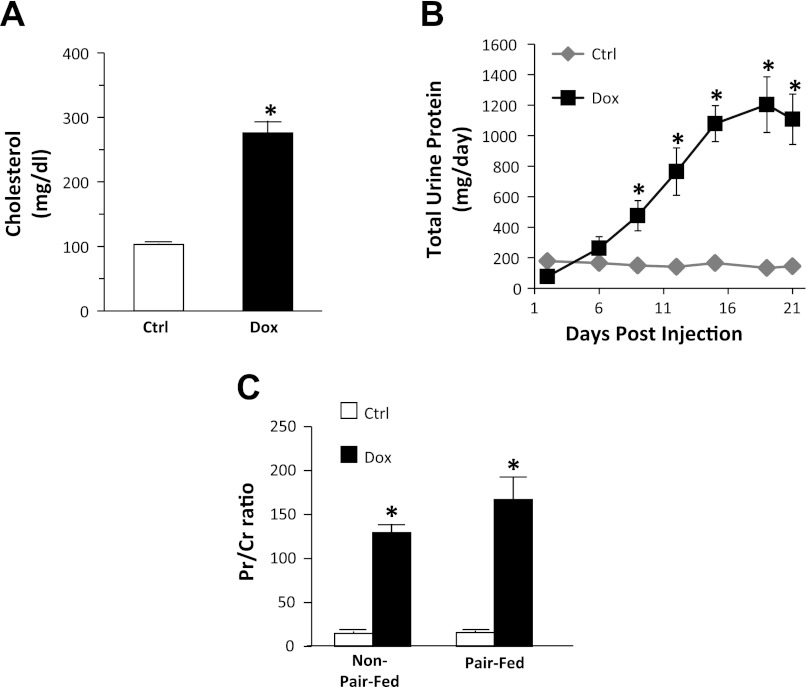
Fig. 2.
Establishment of the nephrotic model. A: serum cholesterol levels compared between control (open bar; Ctrl) and doxorubicin (Dox)-treated rats (filled bar). B: total urinary protein excretion in pair-fed rats. C: urine protein-to-creatinine ratio in both non-pair-fed and pair-fed rats. Data are expressed as means ± SE (non-pair-fed n = 18 treated, 12 controls; pair-fed n = 10; *P < 0.01).

