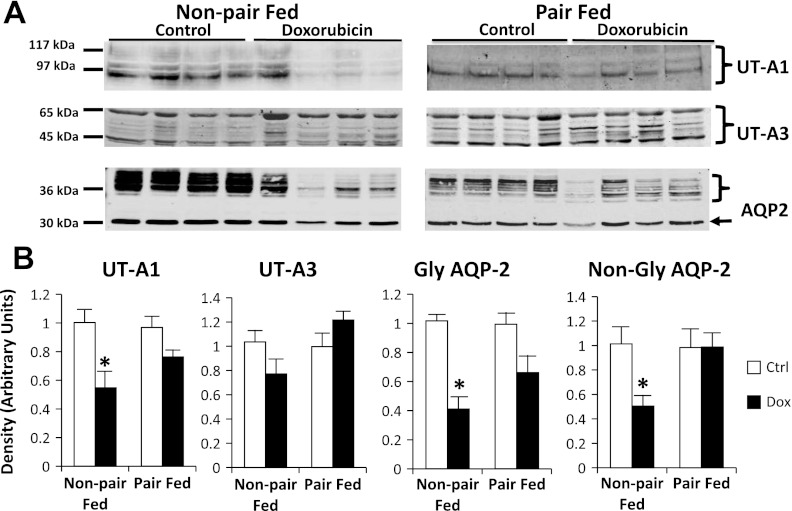
Fig. 6.
UT-A1, UT-A3, and aquaporin 2 (AQP2) abundance in rat inner medullary (IM) tip tissue of the control (Ctrl) group and Dox-treated group. Non-pair-fed as well as pair-fed animals were evaluated. A: representative immunoblots showing abundance of UT-A1, UT-A3, and AQP2 in rat IM tip tissue lysates. The right arrow points to the nonglycosylated (non-gly) AQP2 band. The right brace signifies glycosylated (gly) AQP2 bands. An equal amount of total protein from a different rat tissue sample was loaded into each lane. B: densitometric analysis of Western blots from 3 non-pair-fed and 2 pair-fed cohorts of animals. Data were normalized for the average densitometry of untreated animals in each group and adjusted for alkaline phosphatase as a control protein. Separate densitometric analysis was performed for gly and non-gly AQP2. Data are expressed as means ± SE (non-pair-fed n = 18 treated, 12 controls; pair-fed n = 10; *P < 0.05).

