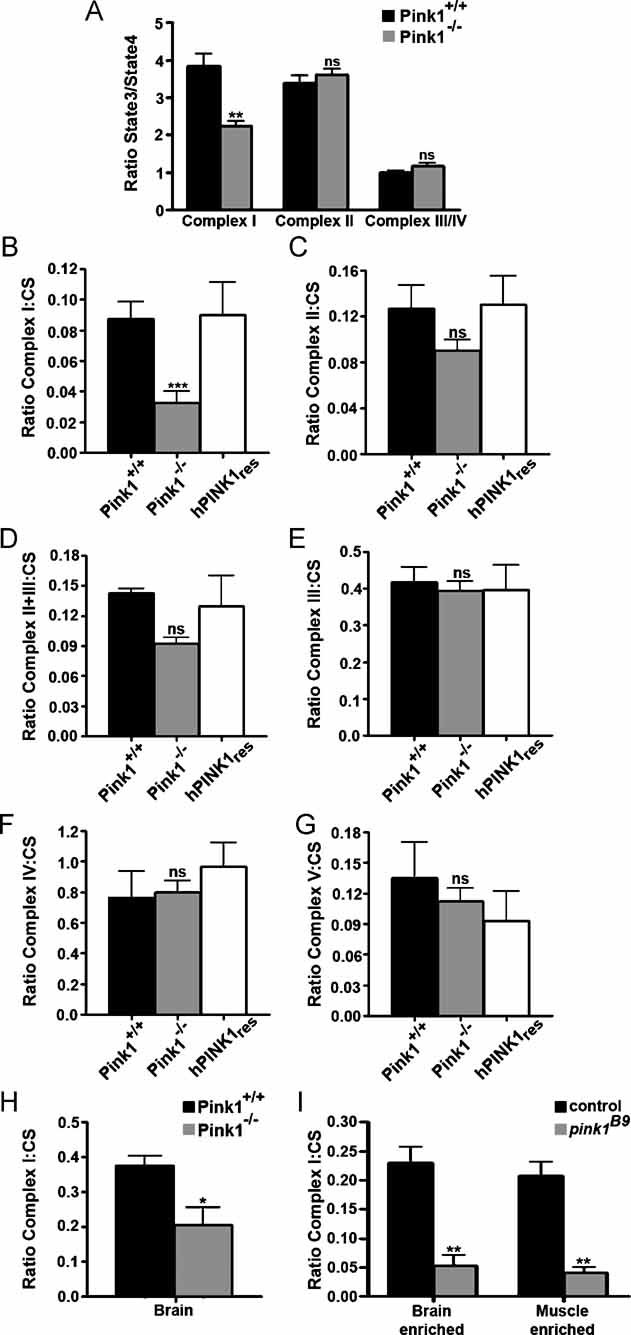
Figure 5. PINK1 deficit results in defects in Complex I of the electron transport chain.

A. To measure the respiration rates between stimulated and basal ADP (ratio State3/State4), mitochondria were isolated from Pink1+/+ and Pink1−/− mice by differential centrifugation and were incubated in the experimental buffer. Mitochondrial oxygen consumption assays were performed in the presence of 5 mM glutamate/2.5 mM malate for the analysis of Complex I-driven respiration; 5 mM succinate in the presence of 2 µM rotenone for Complex II-driven respiration; or 3 mM ascorbate plus 150 µM TMPD in the presence of 0.5 µg/ml antimycin A for Complex IV-driven respiration. Mitochondrial oxygen consumption was measured by using a Clarke-type oxygen electrode (Hansatech Instruments). Data represent the average ± SEM of three independent experiments.
B–G. Respiratory chain measurements performed on mitochondrial homogenates from Pink1+/+, Pink1−/−, and also the rescue cell line with human PINK1 (hPINK1res) fibroblast cells were analysed by spectrophotometric assays for the activity measurement of (B) Complex I (NADH:ubiquinone oxidoreductase, rotenone sensitive), (C) Complex II (succinate:ubiquinone oxidoreductase, malonate sensitive), (D) Complex II+III, (E) Complex III (ubiquinone:cytochrome c oxidoreductase, antimycine sensitive), (F) Complex IV (cytochrome c oxidase). Measurements of (G) Complex V (ATPsynthase, oligomycine sensitive) and citrate synthase enzyme activities were also performed. The protein concentration was 2–4 mg/ml. Values were plotted according to the ratio between the specific complex's activity and citrate synthase activity.
H. Respiratory chain Complex I measurements were performed on mitochondrial homogenates from Pink1+/+ and Pink1−/− mouse brain tissue by spectrophotometric assays (NADH:ubiquinone oxidoreductase, rotenone sensitive). Citrate synthase enzyme activities were also performed. Values were plotted according to the ratio between the specific Complex I activity and citrate synthase activity.
I. Respiratory chain Complex I measurements were performed on fly mitochondrial homogenates from control (w pink1REV) and pink1 mutant (w pink1B9) brain enriched (heads) and muscle-enriched (thorax) tissues by spectrophotometric assays (NADH:ubiquinone oxidoreductase, rotenone sensitive). Citrate synthase enzyme activities were also performed. Values were plotted as a ratio of the specific Complex I activity and citrate synthase activity. Statistical analysis was performed using the unpaired Student's t-test, where *p = 0.03, **p < 0.005 and ***p = 0.00006 when compared to wild-type (Graph Pad Prism5 software). Data represent average ± SEM of at least three independent experiments. ns = non-significant.
