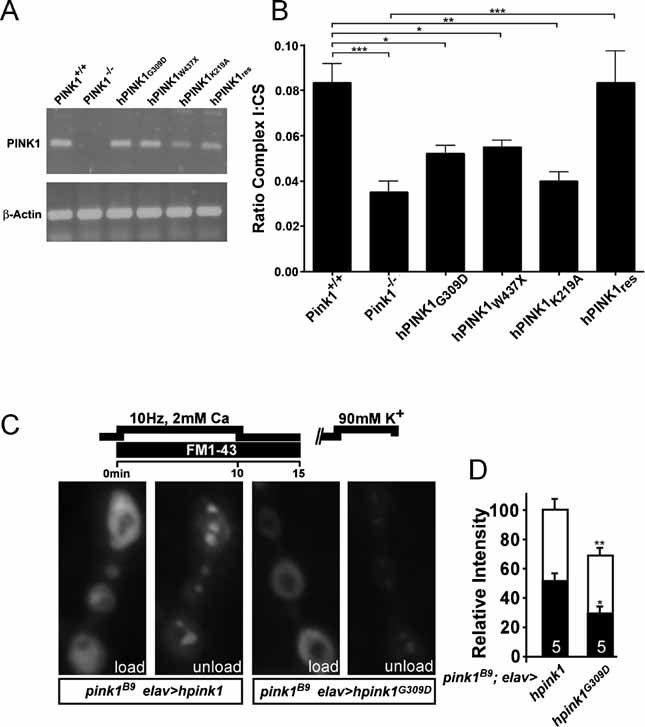
Figure 6. PINK1 clinical mutations also show reduced Complex I function and concomitant defects in synaptic function.

A. PD-related PINK1 mutants were transfected in Pink1−/− fibroblasts and expression levels were analysed by reverse transcriptase-PCR for mRNA detection.
B. Respiratory chain measurements performed on mitochondrial homogenates from Pink1 deficient fibroblast cell lines stably expressing human PINK1 (hPINK1res), PD-related PINK1 mutant hPINK1G309D and hPINK1W437X, and the artificial mutant hPINK1K219A. Spectrophotometric assays for Complex I activity (NADH:ubiquinone oxidoreductase, rotenone sensitive) were performed. Statistical analysis was done using the unpaired Student's t-test, where ***p = 0.00006, where **p < 0.004 and *p < 0.01 (Graph Pad Prism5 software). Data represent the average ± SEM of five independent experiments. ns = non-significant. Values presented for Pink1+/+, Pink1−/− and hPINK1res were previously shown in Fig 4A.
C, D. Reserve pool (RP) labelling in pink1 mutants that neuronally express wild-type human hPINK1 (w pink1B9/Y; elav-GAL4/UAS-hPink1) or the PD-related hPINKG309D mutant (w pink1B9/Y; elav-GAL4/UAS-hPink1G309D). Both the ECP and RP in these animals were labelled by electrically stimulating motor neurons of third instar fillets in HL-3 with 2 mM Ca2+ for 10 min and then leaving the dye with the preparation to rest for 5 min following stimulation (C, ‘load’). ECP vesicles, but not RP vesicles, were subsequently re-mobilized by incubating preparations for 5 min in 90 mM KCl, 2 mM Ca2+ and after washing in Ca2+ free HL-3, the same synapses imaged after loading were imaged again (C, ‘unload’). Fluorescence intensity of loading and unloading, normalized to loading intensity of pink1 mutants that express hPink1 in their neurons, was quantified (D). Note that wild type hPink1 can rescue RP labelling while hPink1G309D cannot. Comparison of RP labelling in w pink1B9 and w pink1B9/Y; elav-GAL4/UAS-hPink1G309D is not statistically significantly different. Statistical analysis was performed using the unpaired Student's t-test, where *p < 0.05; **p < 0.01 when compared to control. ns = non-significant. The number of animals tested is indicated in the bar graphs and error bars indicate SEM. White bars: load; black bars: unload.
