
Figure 1. Heat map of transcripts differentially expressed between cultured NHSCs and cultured dNFSCs, pNFSCs and MPNST cell lines.
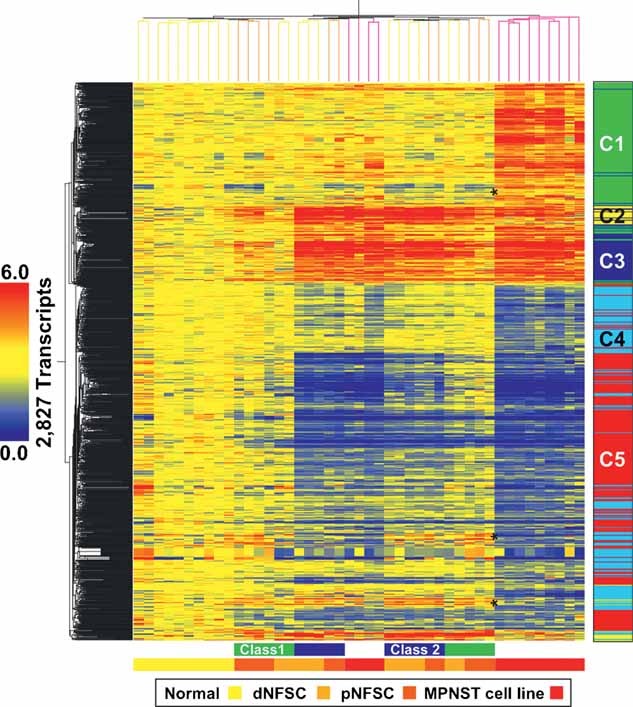
Two-way hierarchical clustering grouped samples as either NHSCs, mixed benign dNFSC and pNFSC or malignant tumour (MPNST) cell lines. Two classes of NFSCs are identifiable, with Class 1 NFSC (green bar beneath the heat map) expression levels attenuated relative to Class 2 NFSC (blue bar beneath the heat map) levels. Genes in clusters C1 and C4, which show decreased or increased expression in benign tumours, respectively, and opposite expression in MPNST cell lines (indicated with asterisks), are abundant in genes associated with cell cycle (AURKA, CDC25B, CDKN2A, CNAP1, INHBA, MCM7, PDGFB) and cell differentiation (ADAM12, ANGPTL4, BMP1, CHL1, IL11, INHBA, PPL, SERPINE2). The bar to the right of the heat map shows five clusters (C1–C5), corresponding to k-means functional clusters listed in Tables S2 and S3 of Supporting Information.