
Figure 1. HH-GLI pathway expression and localization in human CCs.
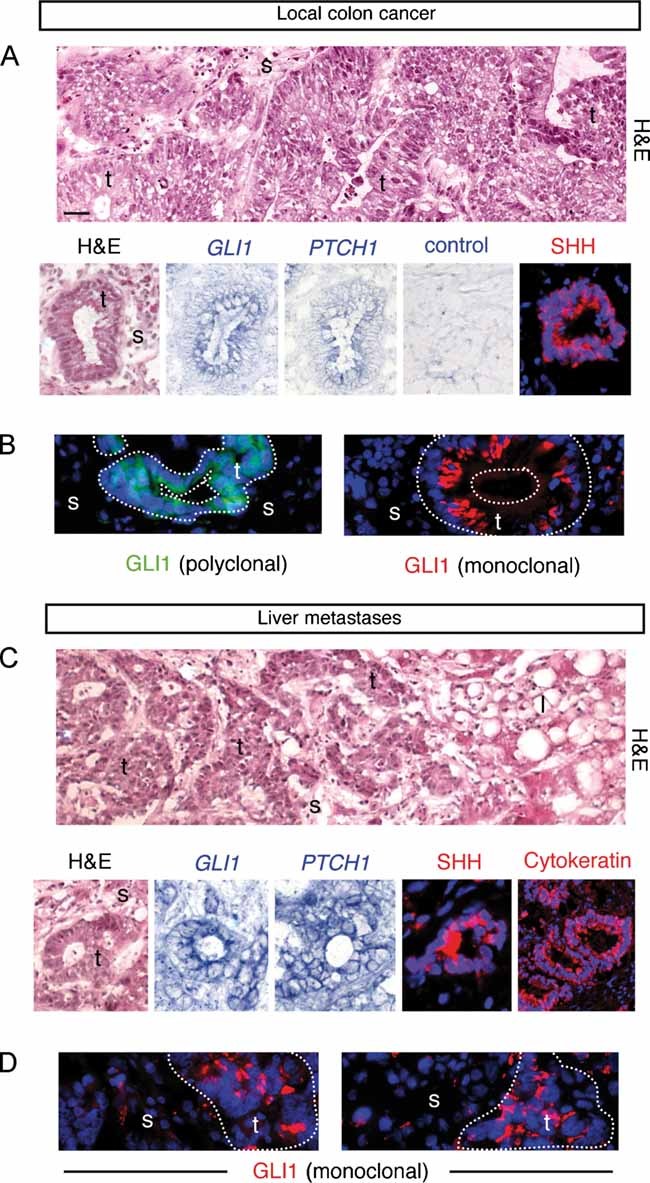
- Analysis of CCs localized in the colon. Hematoxylin and eosin (H&E) staining, in situ hybridization for /GLI1/ and /PTCH1/ mRNAs (blue; CC7) and SHH (red; CC14) in (A) and GLI1 protein (green; CC6) in (B) in CC epithelial cells as indicated.
- Analysis of metastatic CCs localized in the liver. H&E staining, in situ hybridization for /GLI1/ and /PTCH1/ mRNAs (blue; mCC2), SHH (red; mCC11) and cytokeratin (red; mCC11) in (C) and GLI1 protein (green; mCC1) in (D) in CC epithelial cells as indicated.
- The top panels of (A, C) show wider views of the local CC6 and metastatic mCC2 tumors, depicting local colon invasion and high-grade dysplastic morphology (A) and liver invasion (C). Nuclei (blue) are stained with DAPI immunofluorescence images for SHH, cytokeratin and GLI1. l: liver cells, s: stroma; t: tumor. Scale bar = 50 µm for all panels.