
Figure 3. Requirement of HH-GLI signalling for CC growth in vitro.
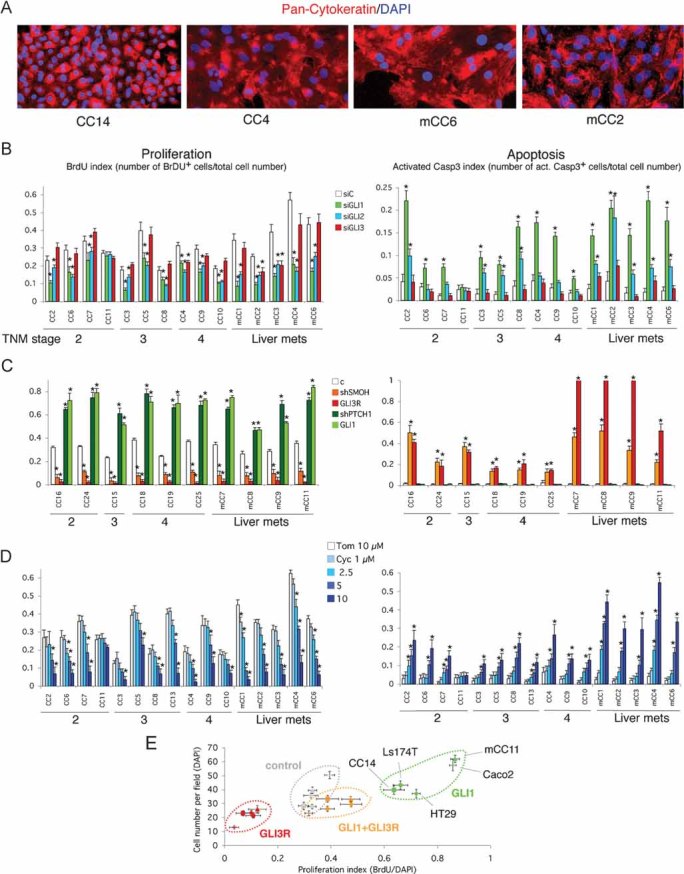
A. Representative CC primary cultures labelled with pan-Cytokeratin antibodies (red) with more than 90% Cytokeratin+ cells (see Fig S1 of Supporting Information), demonstrating their epithelial nature.
B, C. Effects of siRNAs (B) and lentivectors (C) as noted on proliferation (BrdU index: number of BrdU+ cells over total number of cells), and apoptosis (cleaved Caspase-3 index: number of cleaved Caspase-3+ cells over total number of cells). Asterisks in these and all panels denote significant changes (p < 0.05) as compared with controls. mRNA target destruction efficiencies for siGLI1 was 85% on average in seven primary cultures tested; 83.3% for siGLI2; and 83.5% for siGLI3; for shRNAs: 86.9% for shSMOH and 83.9% for shPTCH1 on average in four primary cultures analyzed, measured by qPCR. Primary cultures of normal liver or normal colon did not grow under the conditions used for CCs.
D. Effects of cyclopamine compared with the inactive compound tomatidine on proliferation (right) shown as BrdU index, and apoptosis (left), shown as cleaved Caspase-3 index. Cyclopamine decreases proliferation and increases apoptosis in a concentration-dependent manner. Samples are shown grouped by TNM stage and liver metastases are shown to the right. CC14 proliferation was similarly inhibited by shSMOH, GLI3 and cyclopamine treatment, and enhanced by shPTCH1 and GLI1 (not shown).
E. Graph of the variation in proliferation index (BrdU incorporation/cell number) compared with total cell number (number of DAPI+ cells) of five CC cells as indicated, responding to expression of GLI1, GLI3R or both simultaneously through lentivector transduction. Control cells were transduced with a parental empty lentivector. All cells respond similarly.
Scale bar = 150 µm (A).