. 2009 Sep;1(6-7):315–322. doi: 10.1002/emmm.200900041

Figure 3. PARP inhibitor sensitivity in human tumour cells.

Figure 3

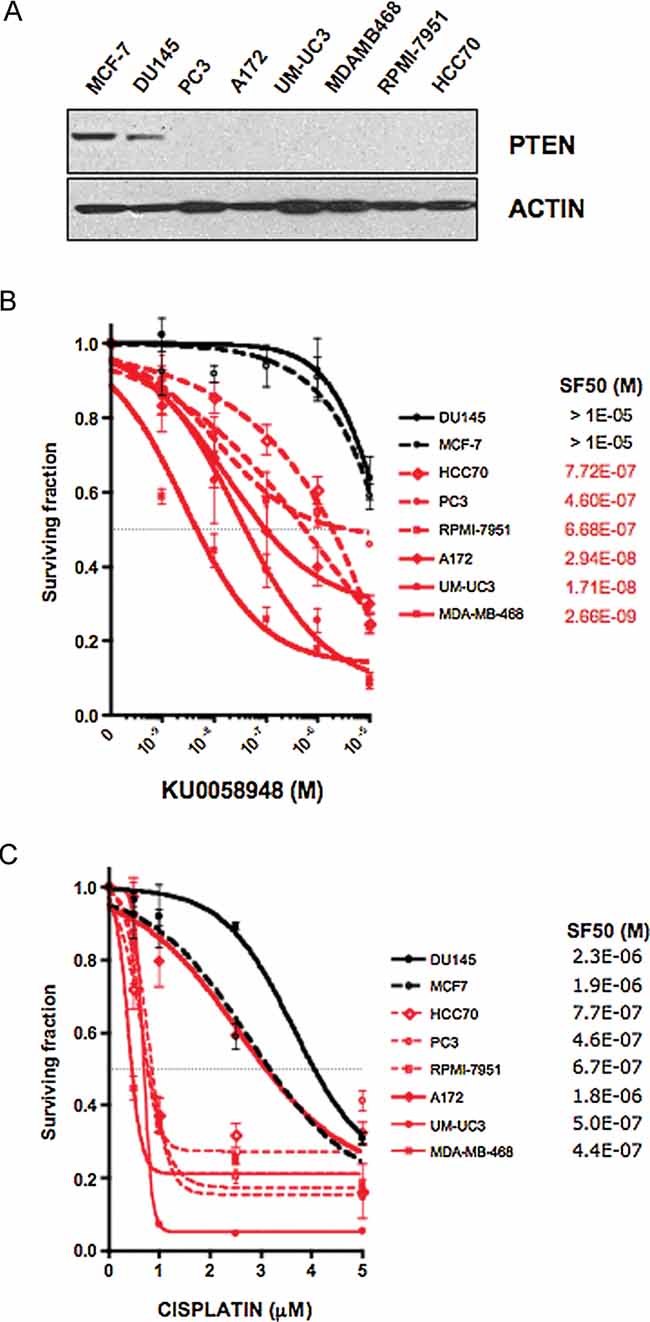
  1. Western blot showing PTEN expression in a panel of human tumour lines. PTEN mutant lines are shown in red and PTEN wild type lines in black. PTEN genotypes are as follows: DU145 (prostate), PTEN wild type; MCF7 (breast), PTEN wild type; PC3 (prostate) p.R55fs*1 homozygous; MDAMB468 (breast), p.A72fs*5 homozygous; A172 (glioma), p.R55fs*1 homozygous; UM-UC3 (bladder), p.M1*404del homozygous; RPMI-7951 (melanoma) p.null, c.1-79del79 homozygous; HCC70 (breast), p.F90fs*9 homozygous (see Table S1 of Supporting Information for complete genotypes).
  2. PARPi sensitivity in the same cell line panel. For each PTEN null line, survival was significantly different than in DU145 and MCF7 cells (p<0.05, two-way ANOVA) (see Fig S3 of Supporting Information for analysis of an enlarged cell line panel).
  3. Cisplatin sensitivity in the same cell line panel. With the exception of A172, survival of each PTEN null line at 1 µM was significantly different than in DU145 and MCF7 cells (p<0.05, two-way ANOVA).