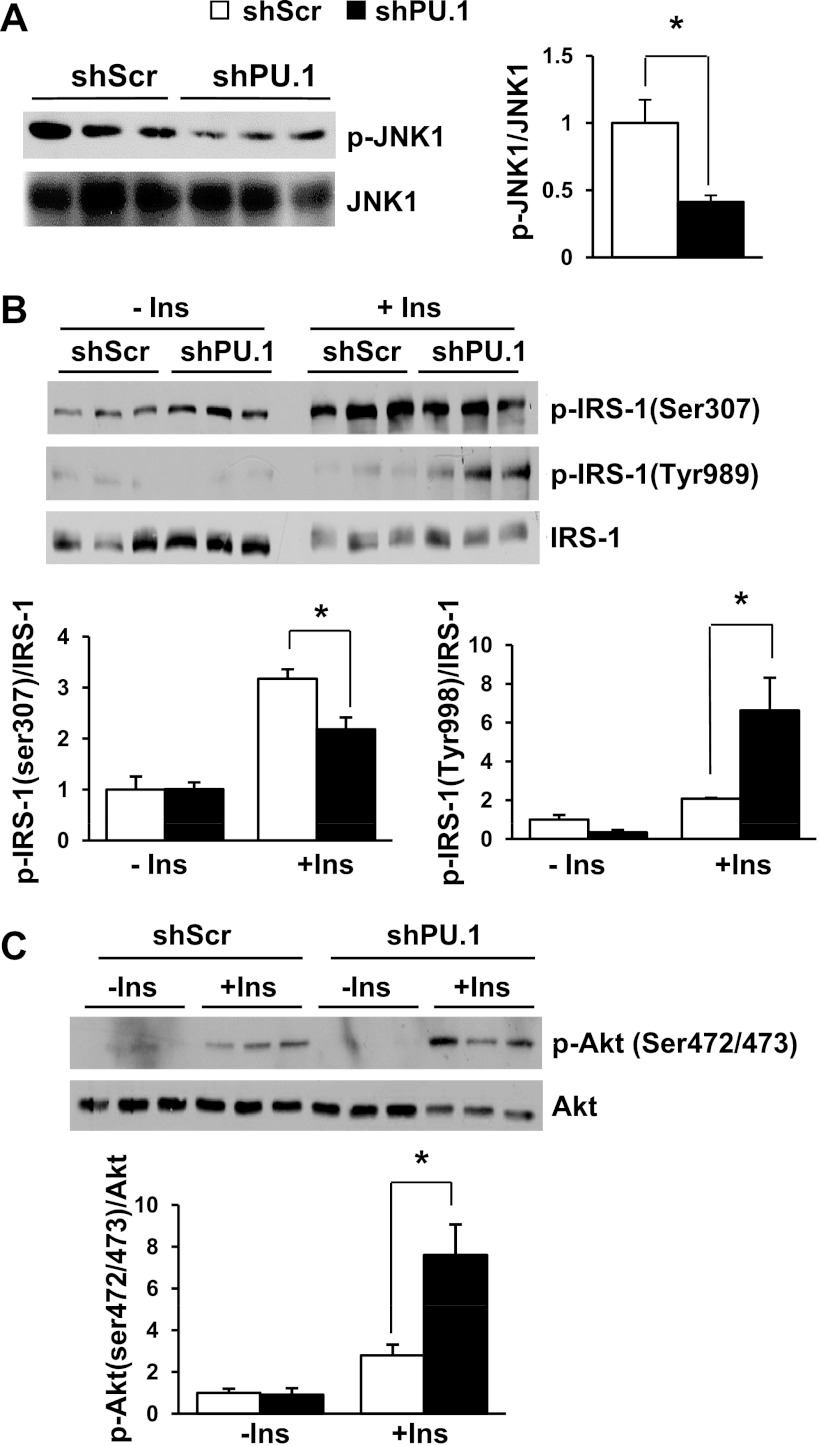
Fig. 5.
Regulation of JNK1 and insulin (Ins) signaling in PU.1 knockdown adipocytes. A: the levels of phosphorylated (p) JNK1 and total JNK1 were detected by Western blot analysis. B: 3T3-L1 adipocytes expressing shPU.1 or shScr were serum starved overnight and then stimulated with 100 nM insulin for 15 min. Immunoblot analysis of p-IRS-1 (Ser307 and Tyr989) and total IRS-1 was performed. C: immunoblot analysis of p-Akt (Ser472/473) and total Akt in the same cells as Fig. 4A. *P < 0.05.

