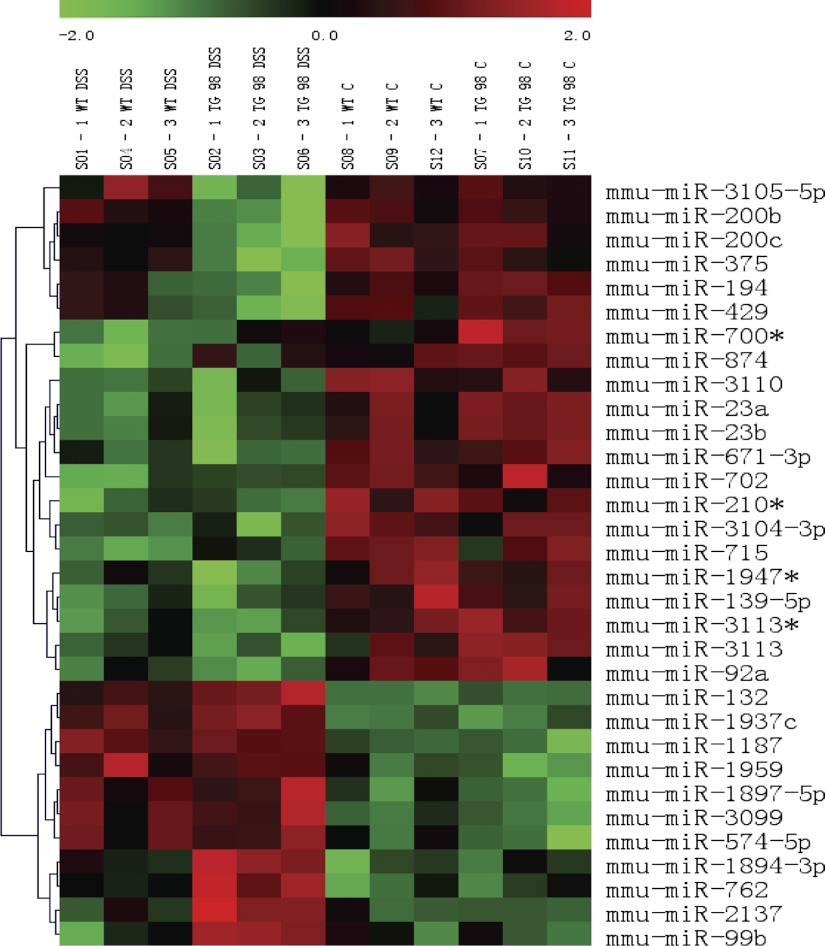
Fig. 2.
MicroRNA (miRNA) microarray clustering graph of colonic miRNA in WT and Tg CD98 mice colon. A total of 32 miRNA transcripts had differential expression in the colon WT and CD98 Tg mice administered with 3% DSS and normal water (control) for 7 days. miRNA transcripts having P value <0.01 are shown above.

