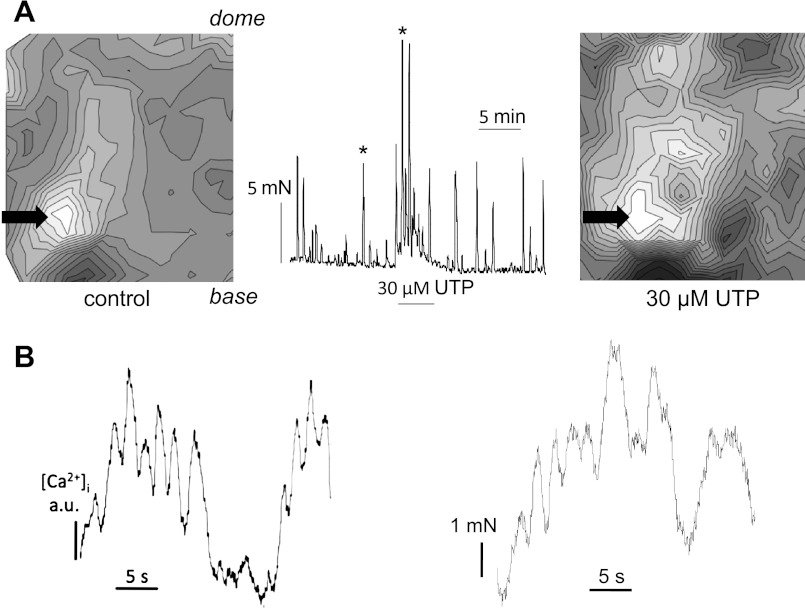
Fig. 3.
Ca2+ wave maps from bladder sheets with an intact mucosa (isochronal interval 100 ms). The base and dome regions of the sheets are indicated in the left-hand maps. A: SCT rat bladder. Maps show sheets in the baseline condition (left) and in the presence of 30 μM UTP (right). The tension trace corresponding to the experiment from which the maps were constructed is shown. Arrows mark the spontaneous contractions corresponding to the 2 maps. UTP was added for the duration of the bar below the trace. The arrows indicate the origins of the propagating wave. B: correspondence between the time course of a Ca2+ transient from a single pixel and contractile activity in a bladder preparation during exposure to 30 μM ADP.

