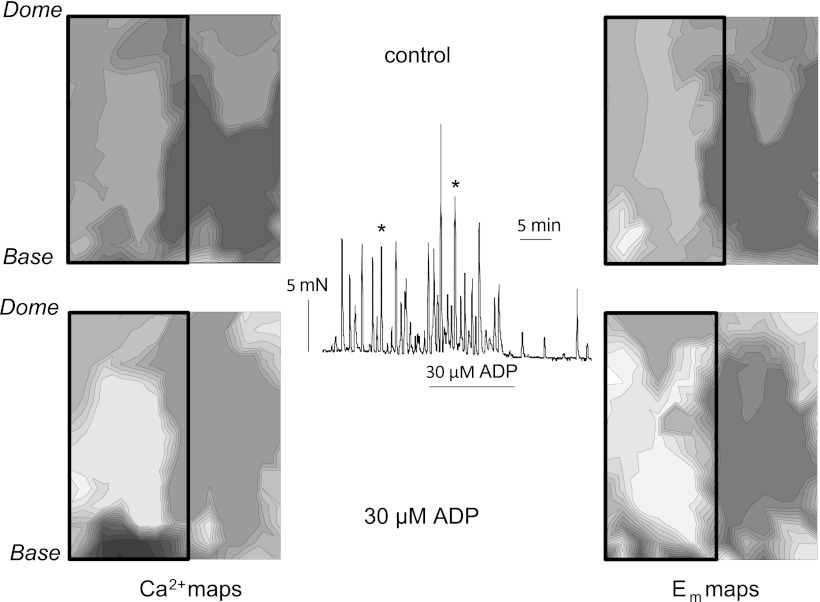
Fig. 5.
Ca2+ (left) and membrane potential (Em; right) maps from a SCT rat bladder sheet. The mucosa was removed from the right-hand side of the sheet; the box marks the area of intact mucosa. Maps were obtained before (top) and during (bottom) the application of 30 μM ADP. Arrows on the tension trace mark the spontaneous contractions corresponding to the maps. ADP was added for the duration of the bar below the trace.

