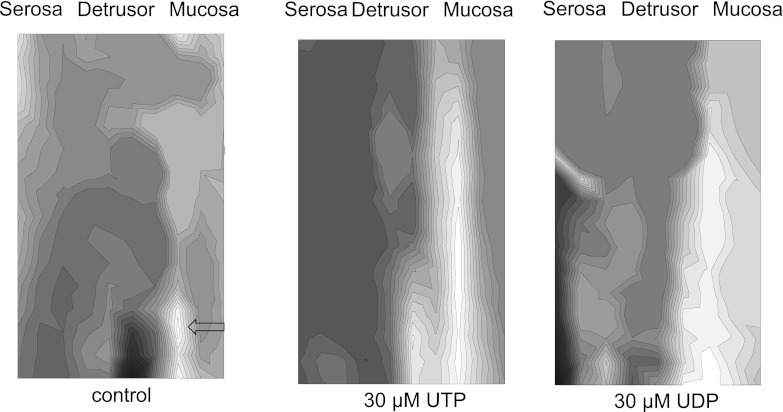
Fig. 6.
Ca2+ maps from a transverse section of a SCT rat bladder in the baseline condition (left) and during the subsequent application of 30 μM UTP and 30 μM UDP. The positions of 2 loci for Ca2+ waves are indicated by the black arrow on the baseline map. The UTP map was obtained immediately after the baseline map. The UDP map was obtained after 15-min washout of UTP.

