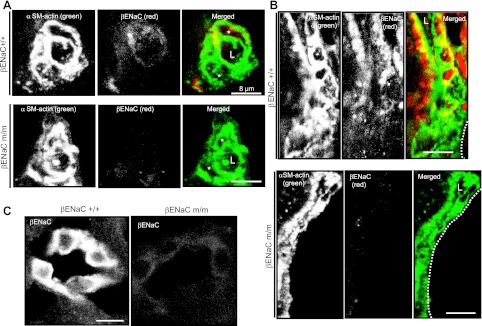
Fig. 1.
β−Epithelial Na+ channel (βENaC) labeling is decreased in afferent arterioles and distal nephron segments of a mouse model of reduced βENaC (βENaC m/m). All images were obtained in the cortex. A: localization of smooth muscle (SM) α-actin (green) and βENaC (red) in a cross-sectional image of a renal arteriole from a βENaC +/+ (top) and m/m (bottom) mouse. In the merged image, the arteriolar lumen is identified by an “L,” and the vascular smooth muscle cell (VSMC) bodies are identified by an asterisk (*). B: localization of SM α-actin (green) and βENaC (red) in a longitudinal section of a renal arteriole from a βENaC +/+ (top) and m/m (bottom) mouse. Dashed lines in merged image represent the glomerular border. Colocalization of βENaC and SM α-actin is identified as yellow labeling in the merged images in A and B. C: βENaC labeling in portions of the distal nephron in βENaC +/+ and m/m mice. Images are representative of 2 trials. Scale bar is equivalent to 8 μm.

